Understanding the US Temperature Map: A State-by-State Analysis
The United States presents a fascinating mosaic of climatic zones, from the frigid tundra of Alaska to the scorching deserts of Arizona. A detailed temperature map reveals not only the average yearly temperatures but also the underlying geographic and atmospheric factors that shape each region. This article examines ten key categories of states, highlighting their characteristic temperature ranges and the implications for agriculture, infrastructure, and daily life.
1. Arctic and Subarctic States
Alaska, the northernmost state, experiences the coldest temperatures in the country, with average winter lows frequently dropping below -20°F (–29°C). The high latitude and extensive ice cover contribute to a short growing season, influencing local economies that rely heavily on fisheries and energy extraction rather than large-scale agriculture. Infrastructure in these regions must be designed to withstand extreme cold, including specialized insulation and heating systems.
2. Temperate Maritime States
Coastal states such as Washington, Oregon, and California benefit from the moderating influence of the Pacific Ocean. Average winter temperatures hover around 40°F (4°C) and summer highs rarely exceed 80°F (27°C). This stable climate supports a diverse agricultural sector, including wine grape cultivation in California’s Central Valley and the abundant produce of Washington’s fruit orchards. The mild weather also encourages year-round tourism and reduces heating costs.
3. Humid Continental States
States like Illinois, Ohio, and New York exhibit a four‑season climate with cold winters and hot, humid summers. Average January temperatures can fall into the 20s°F (–6 to –3°C), while July highs often reach 85–95°F (29–35°C). The significant temperature swing requires robust building codes that accommodate both heating and cooling systems, and it shapes local agriculture by allowing a wide range of crops, from corn to apples.
4. Hot Humid Subtropical States
Florida, Georgia, and the Carolinas fall into the hot humid subtropical zone, where summers frequently see temperatures above 95°F (35°C) coupled with high humidity levels. Winter temperatures remain mild, rarely dropping below 40°F (4°C). This climate supports a long growing season, enabling multiple crop cycles per year, but also increases the risk of hurricanes and requires sophisticated storm‑preparedness infrastructure.
5. Semi‑Arid and Desert States
Arizona, Nevada, and parts of New Mexico experience semi‑arid to arid conditions, with scorching summer temperatures that can exceed 110°F (43°C). Winter temperatures are cooler but still relatively mild. Water scarcity is a critical issue in these regions, influencing both agricultural practices—such as drought‑resistant crops—and the design of irrigation systems. Urban planning must incorporate heat mitigation strategies to protect residents and reduce energy consumption.
6. Mountainous States
Colorado, Montana, and Utah exhibit a wide range of temperatures due to elevation differences. Higher altitudes can see winter lows well below 0°F (–18°C), while lower valleys may experience milder conditions. The varied climate supports diverse ecosystems and a robust outdoor recreation industry. Seasonal temperature variation also necessitates flexible infrastructure capable of handling snow loads and rapid weather changes.
7. Gulf Coast States
Louisiana, Mississippi, and Texas’ coastal regions experience a subtropical climate with hot, humid summers and mild winters. Average summer temperatures routinely reach 90–100°F (32–38°C). These states face significant risks from tropical cyclones and storm surges, making resilient coastal defenses and early warning systems essential. The climate supports extensive rice and sugarcane agriculture, as well as a thriving seafood industry.
8. Midwest Corn Belt
States such as Iowa, Indiana, and Nebraska benefit from a humid continental climate conducive to corn and soybean production. Summer temperatures typically range between 80–90°F (27–32°C), and adequate rainfall supports high yields. Winter temperatures can drop to the low 20s°F (–7 to –4°C), demanding sturdy farm infrastructure and efficient heating solutions for livestock operations.
9. High‑Plateau States
Arizona’s high plateau regions, including the city of Flagstaff, enjoy cooler temperatures year‑round compared to the surrounding desert. Summer highs rarely exceed 80°F (27°C), and winters can dip into the 20s°F (–6 to –2°C). This unique microclimate attracts year‑long tourism and supports a temperate agriculture sector, offering a contrasting profile to the hotter lowlands of the state.
Current Temperature Map Of Us - Printable Map Of The US

Current Temperature Map Of Us - Printable Map Of The US
Cold Temperature Map
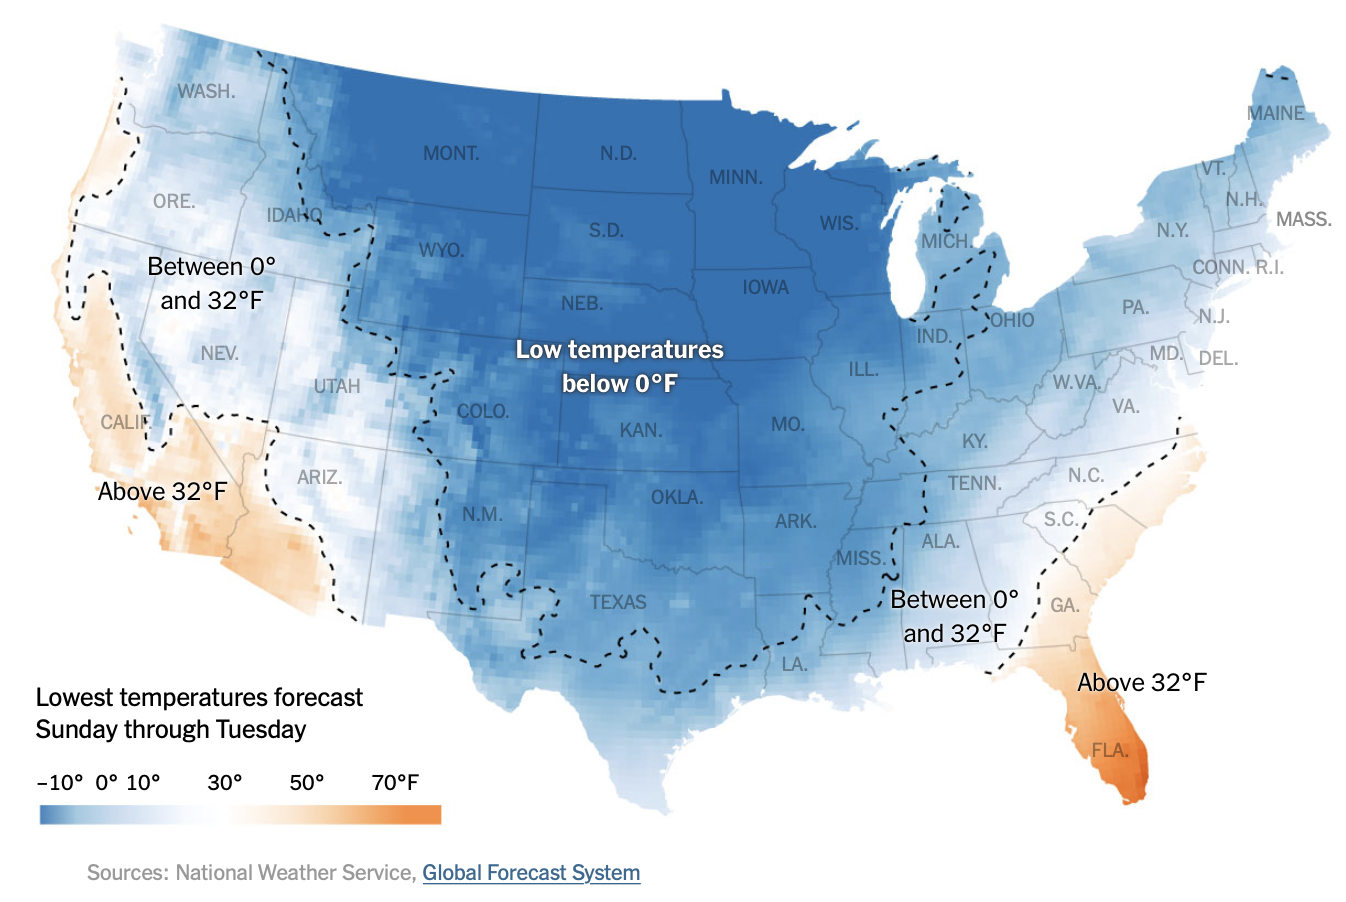
Cold Temperature Map
Images And Media: US_summary_temperature_202209012.png | NOAA Climate.gov
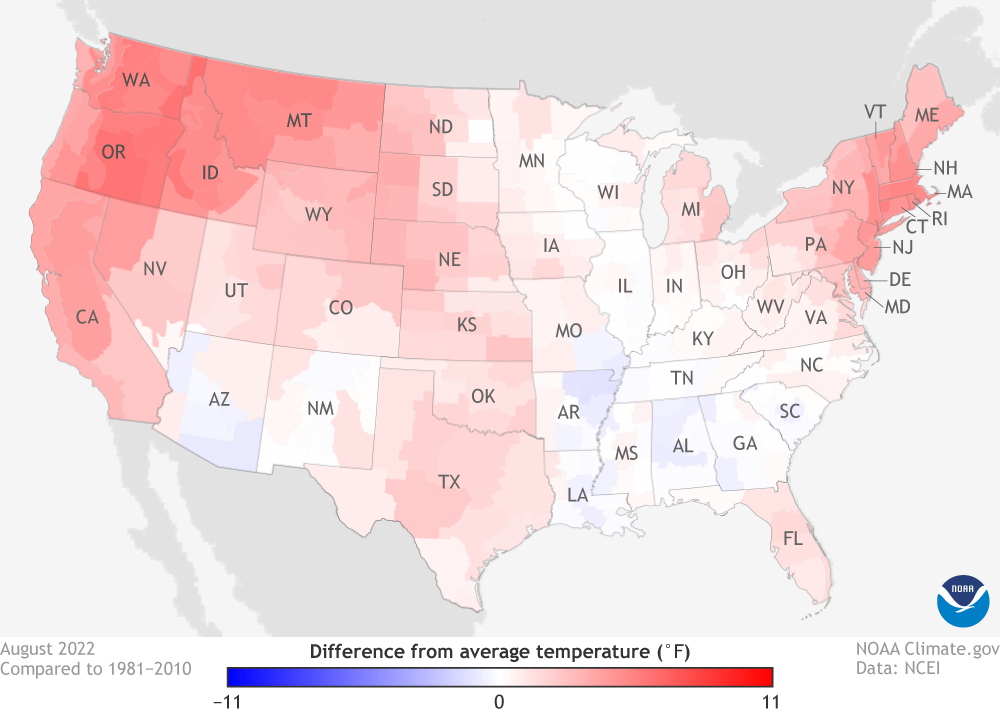
Images and Media: US_summary_temperature_202209012.png | NOAA Climate.gov
Us Weather Map Temperature Highs
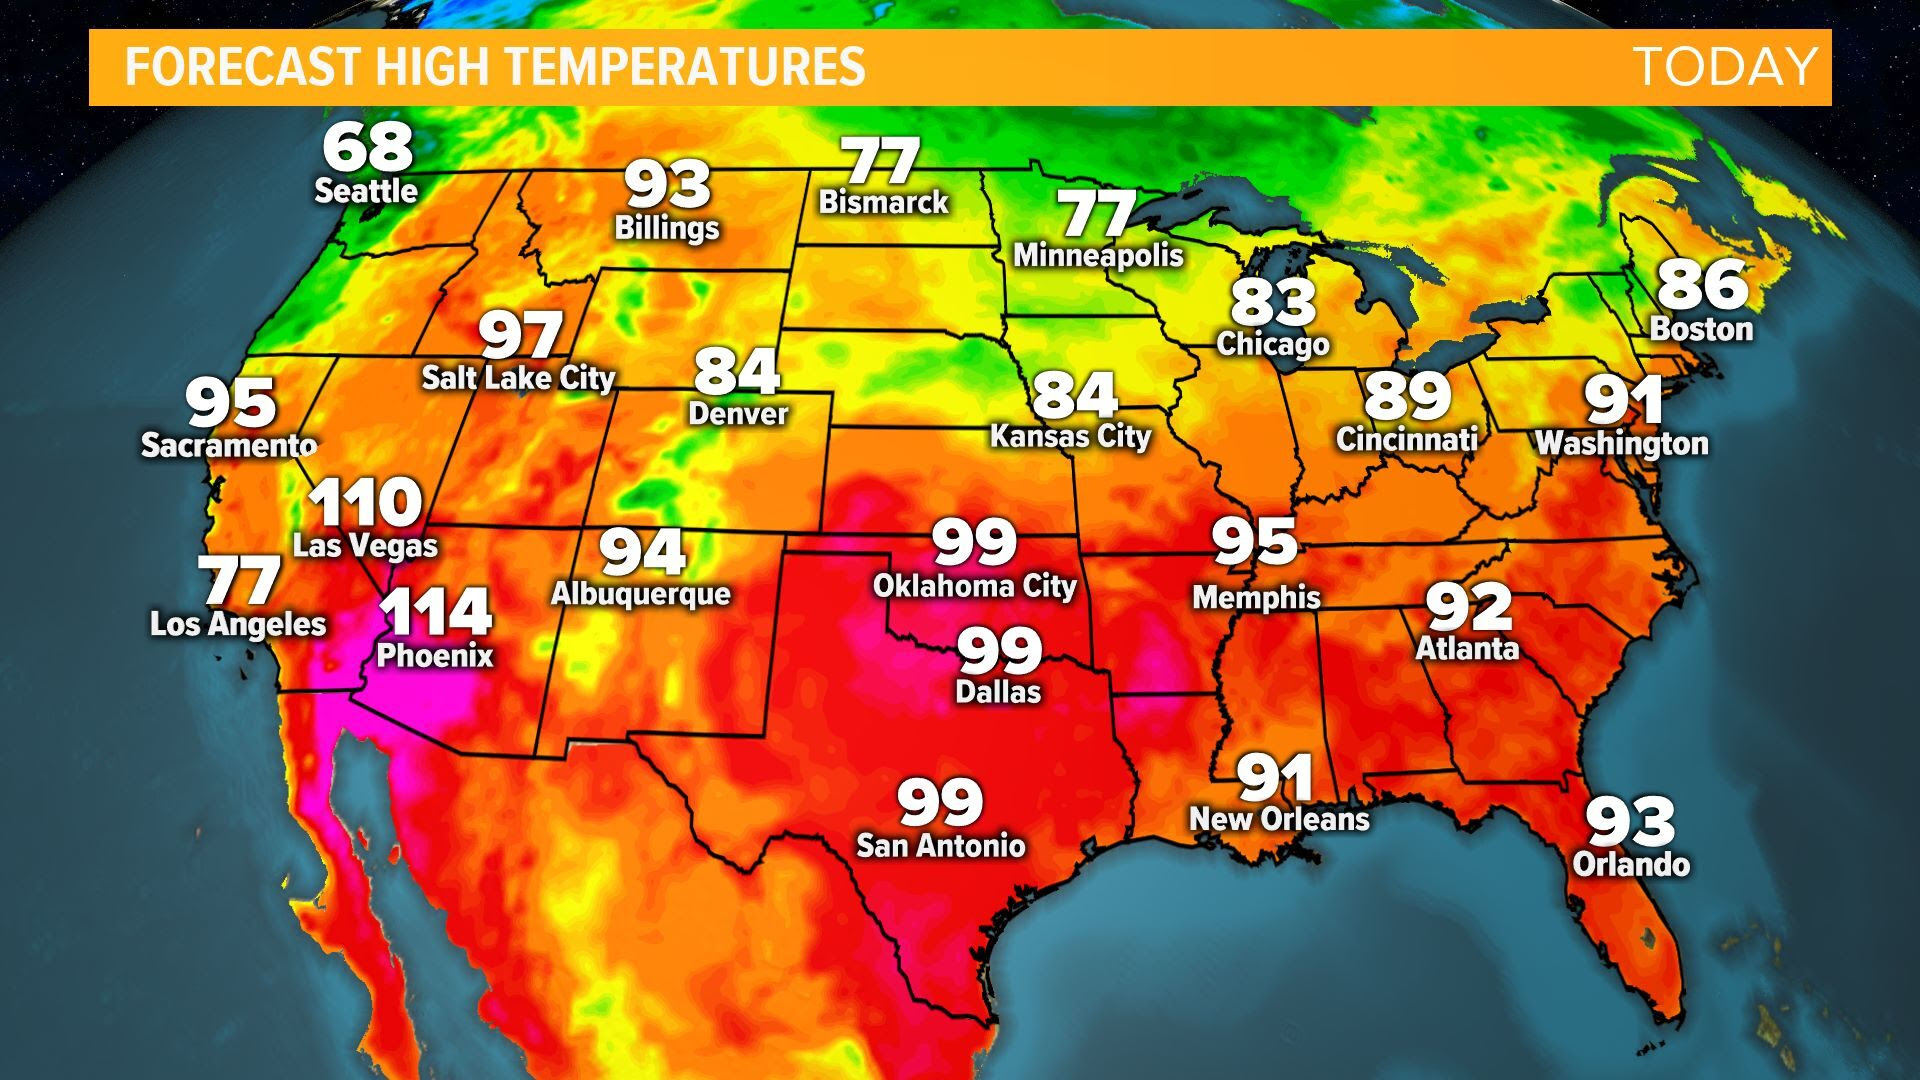
Us Weather Map Temperature Highs
Temperature Mapping Guidance At Elijah Elliston Blog
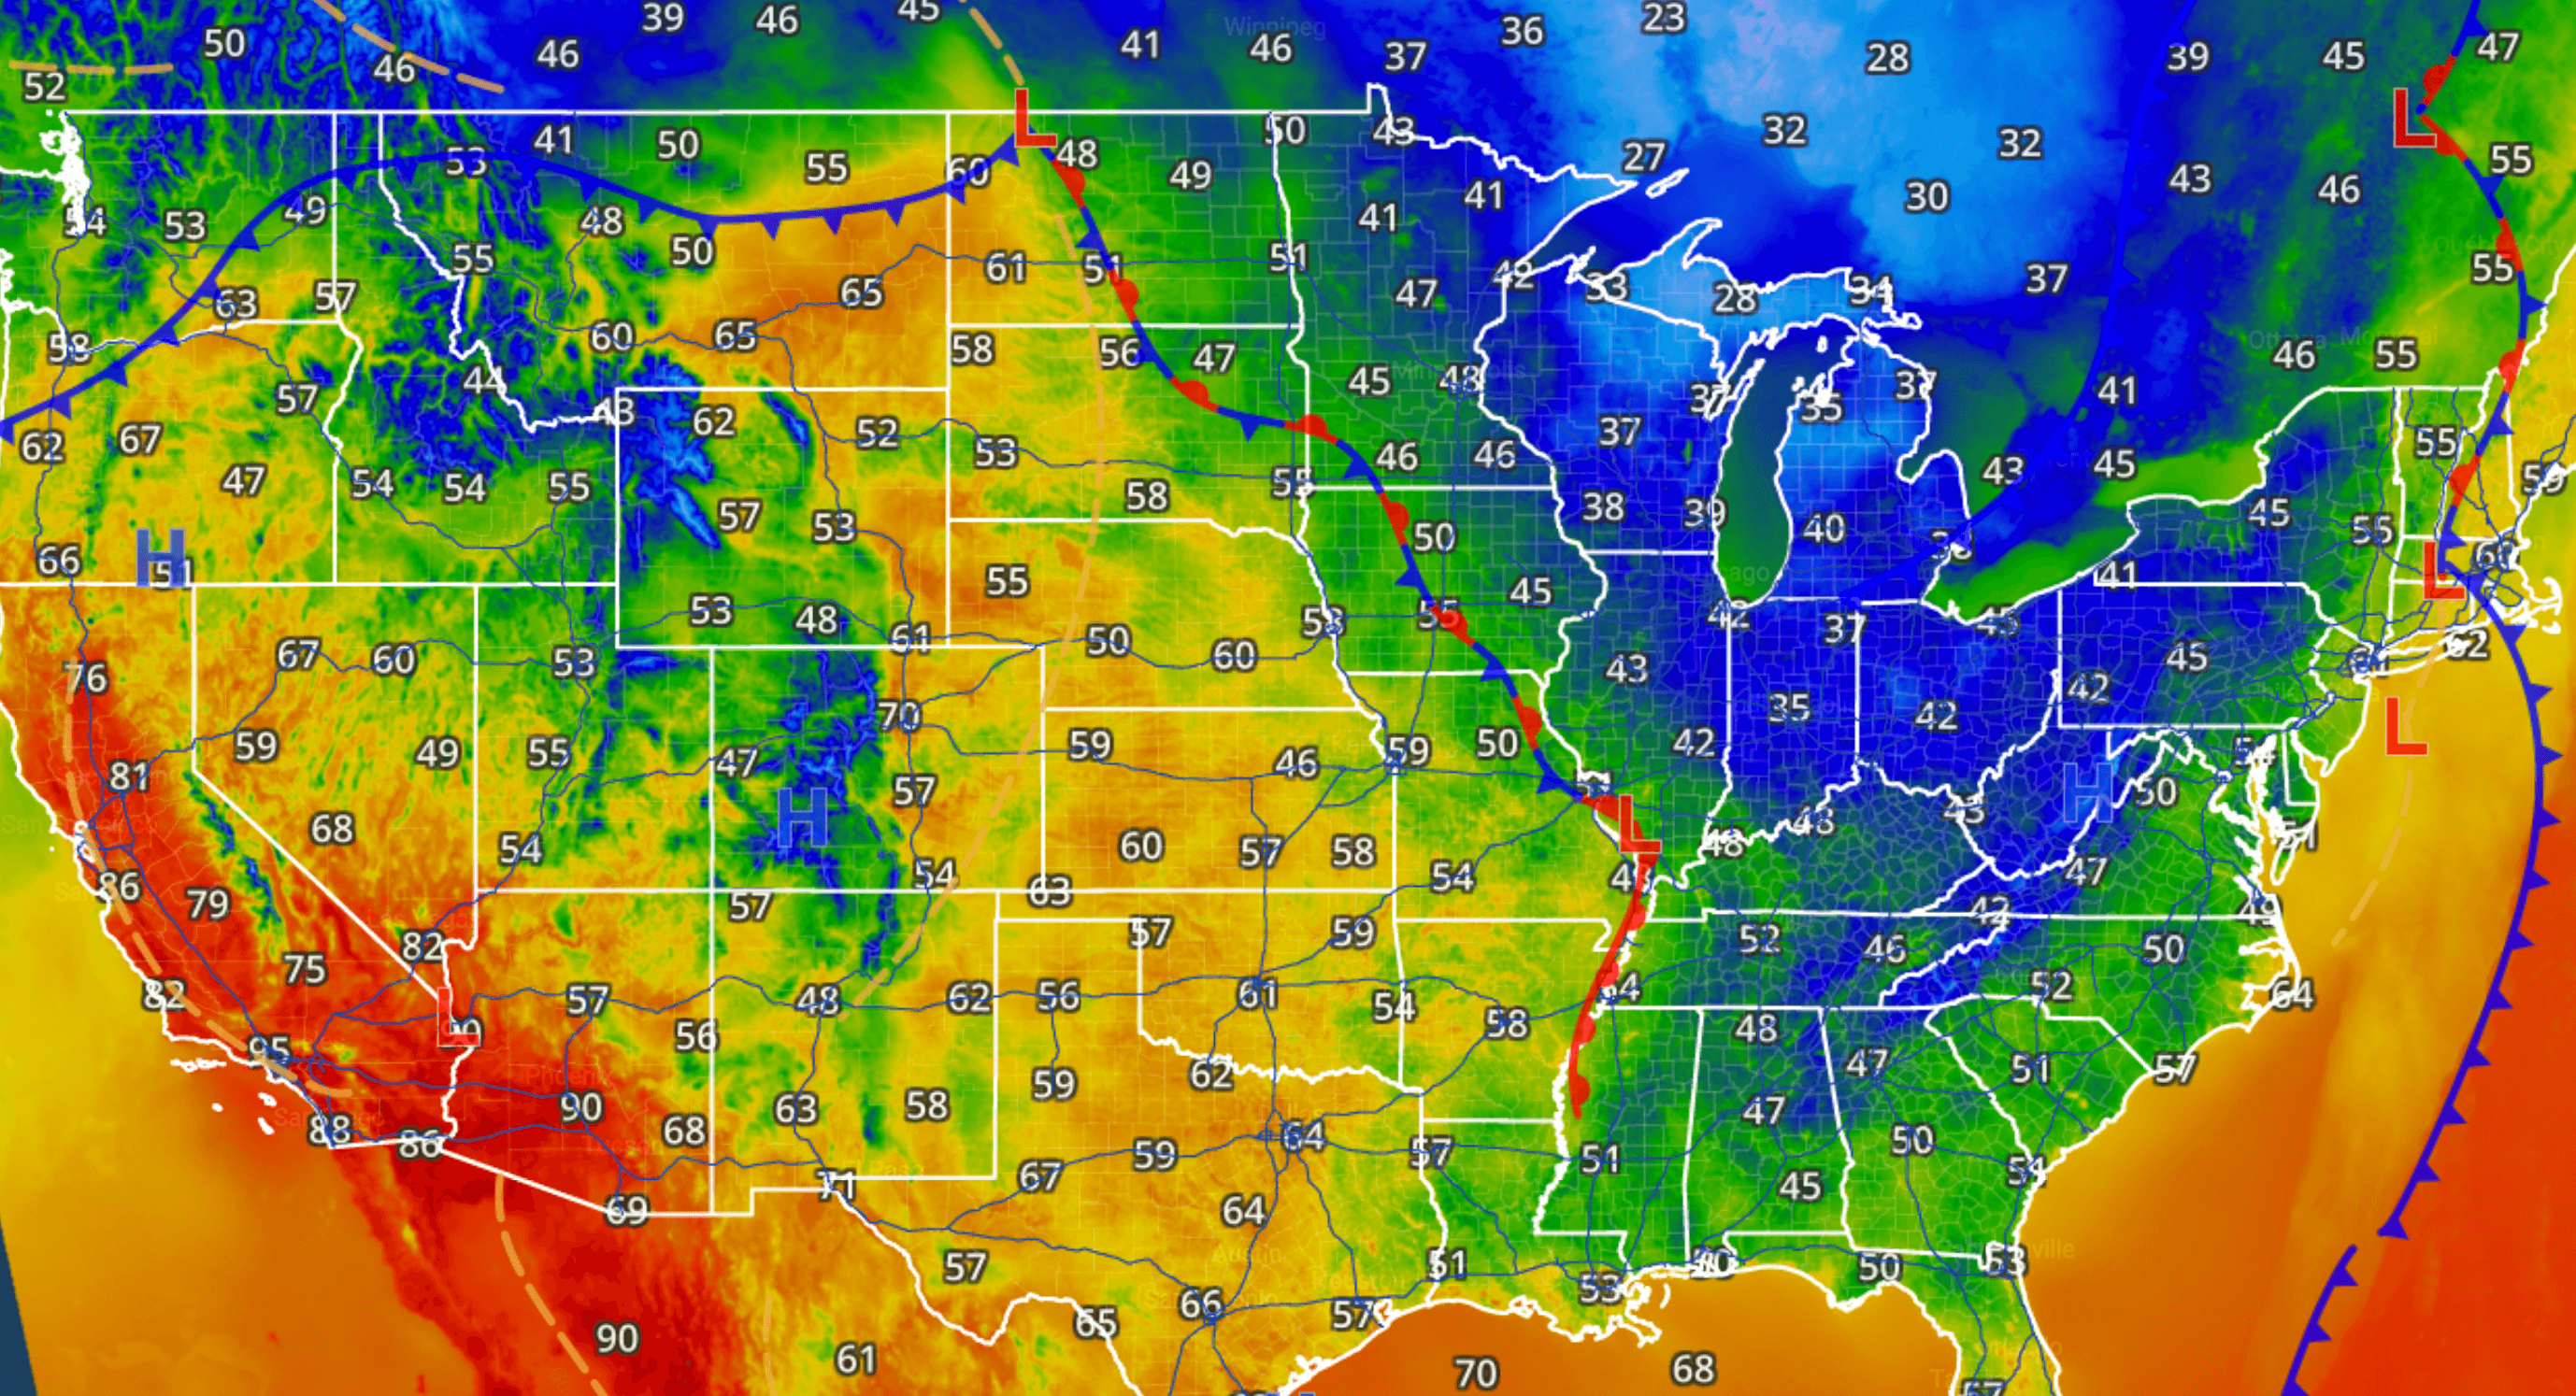
Temperature Mapping Guidance at Elijah Elliston blog
Current Temperature Map Of USA | Printable Map Of USA
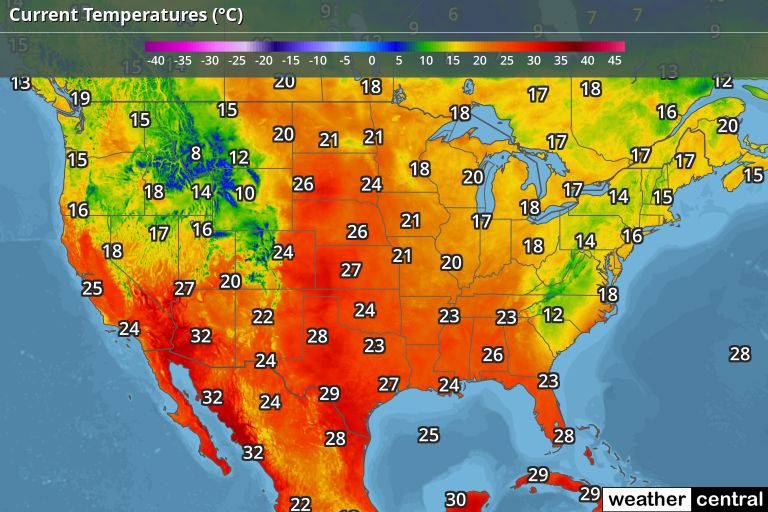
Current Temperature Map Of USA | Printable Map Of USA
Understanding The US Weather Map: A Guide To Temperature Patterns

Understanding The US Weather Map: A Guide To Temperature Patterns ...
Us Weather Map Temperature Highs It's Never Been This Warm In
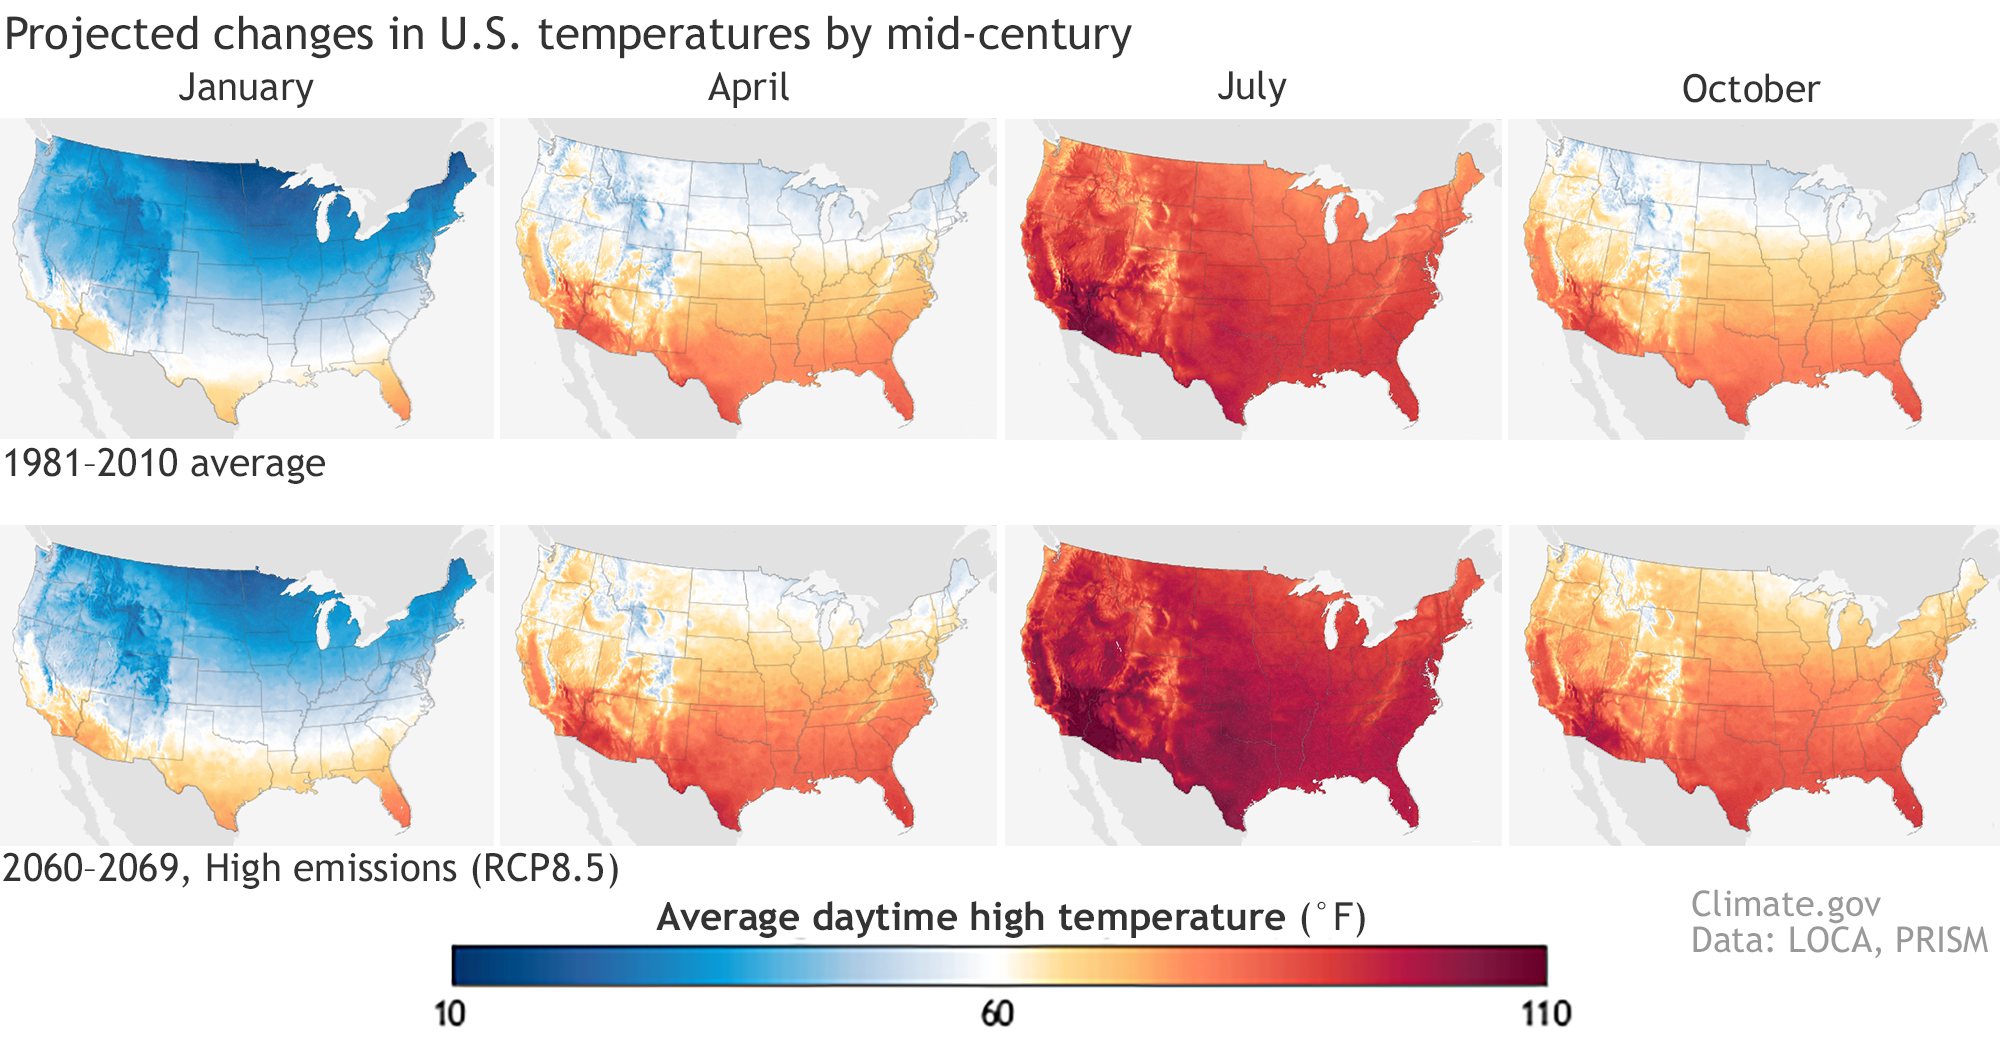
Us Weather Map Temperature Highs It's Never Been This Warm In
Current US Temperature Map -- Weather.com

Current US Temperature Map -- Weather.com
Map Of Us Temperatures Today - Printable Map Of The US

Map Of Us Temperatures Today - Printable Map Of The US
US Temperature Map | Temperature Map Of United States
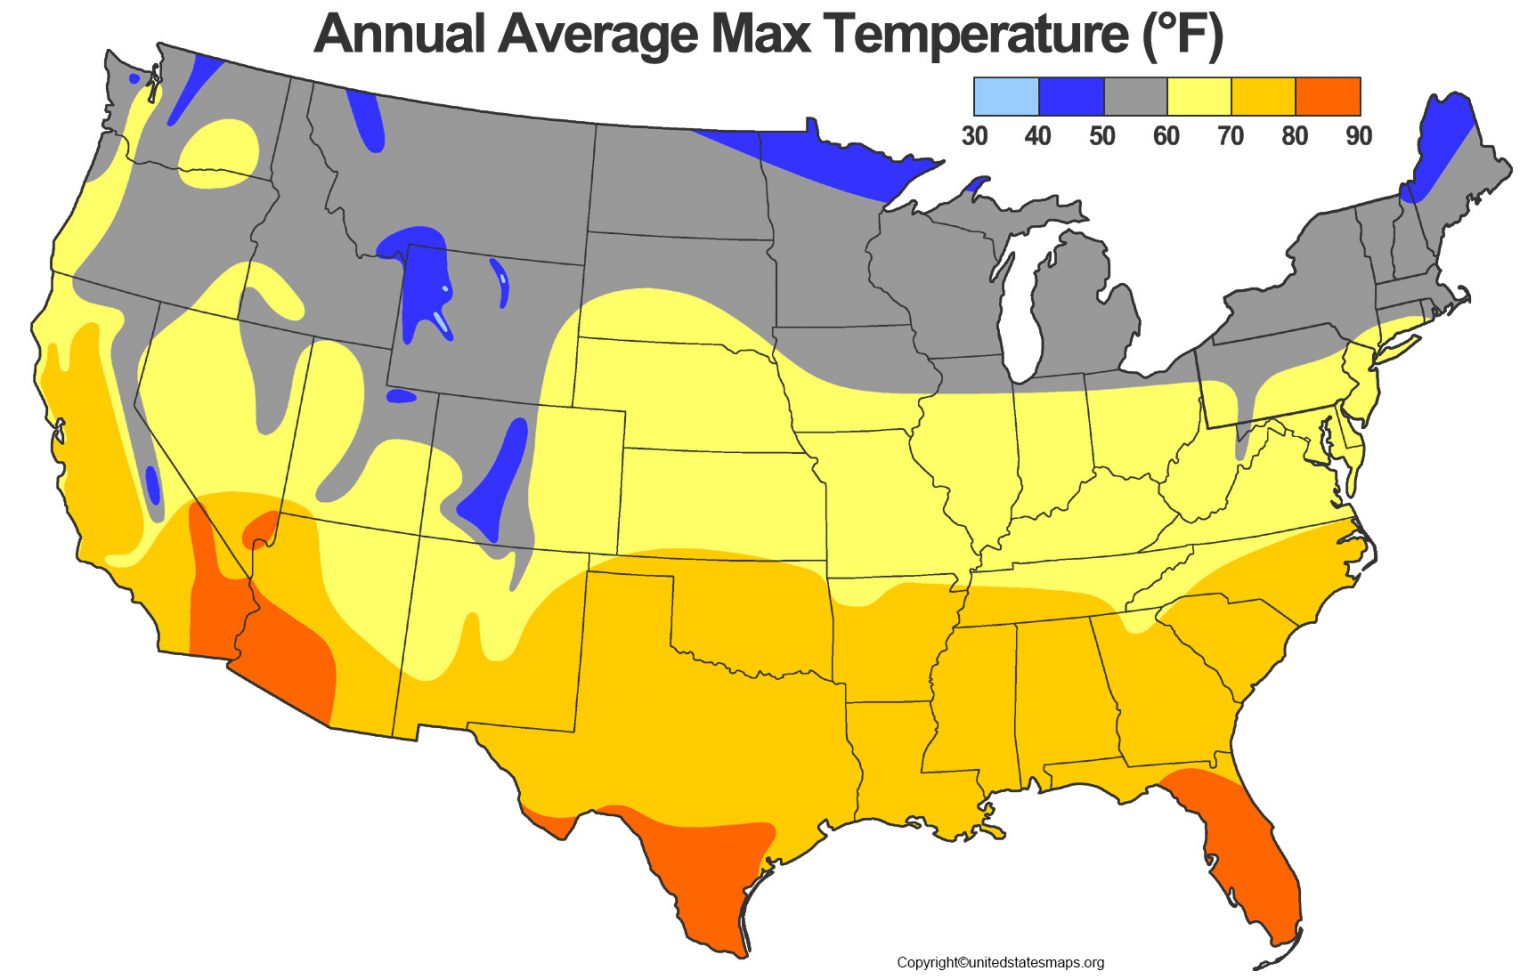
US Temperature Map | Temperature Map of United States
Us Weather Map Temperature Highs It's Never Been This Warm In

Us Weather Map Temperature Highs It's Never Been This Warm In
West Coast Of The United States Satellite Maps, Radar Maps And Weather Maps
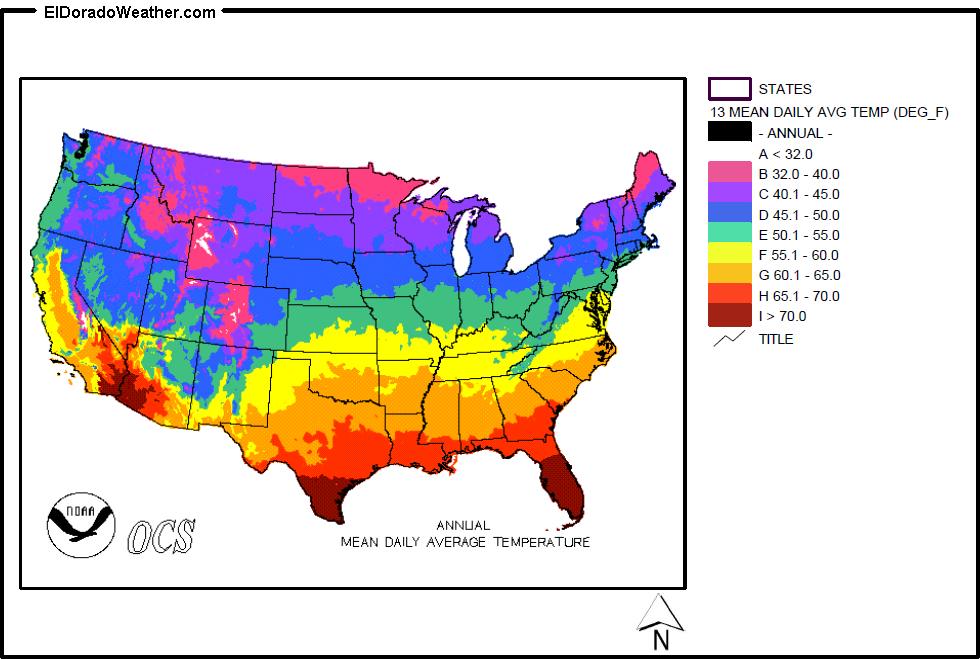
West Coast of the United States Satellite Maps, Radar Maps and Weather Maps
Current Temperature Map For The United States – ETKTD

Current Temperature Map For The United States – ETKTD
Us Weather Current Temperatures Map Weathercentralcom

Us Weather Current Temperatures Map Weathercentralcom
US Weather Map | United States Weather Map [USA]
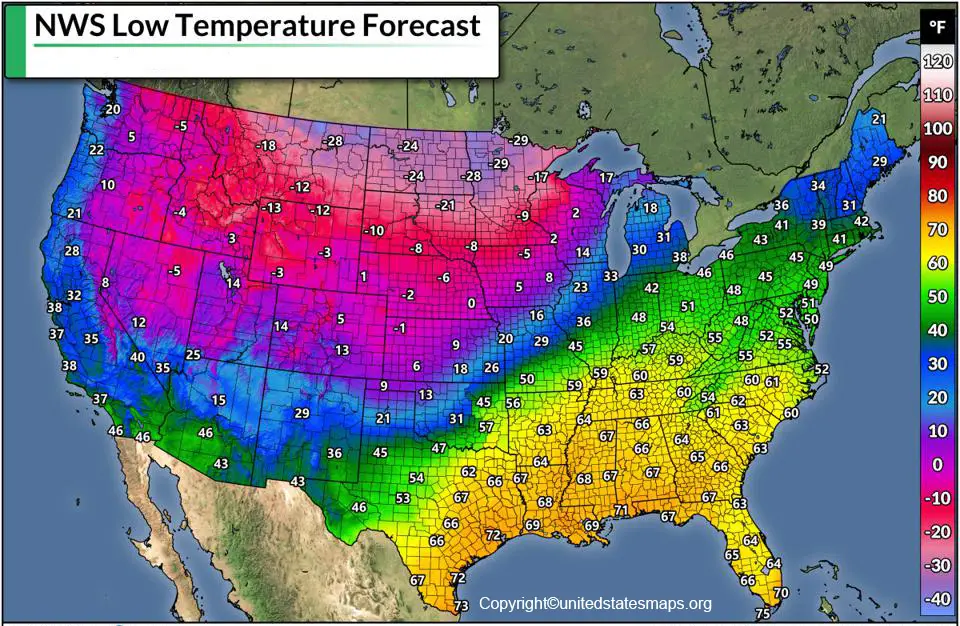
US Weather Map | United States Weather Map [USA]
January Temperature Outlook For The United States | Weather.com

January Temperature Outlook For The United States | Weather.com
Us Weather Map Temperature Highs

Us Weather Map Temperature Highs
Images And Media: July-cpc-us-climate-outlook-temperature-20240701.png

Images and Media: july-cpc-us-climate-outlook-temperature-20240701.png ...
USA Climate Map | Printable Map Of USA
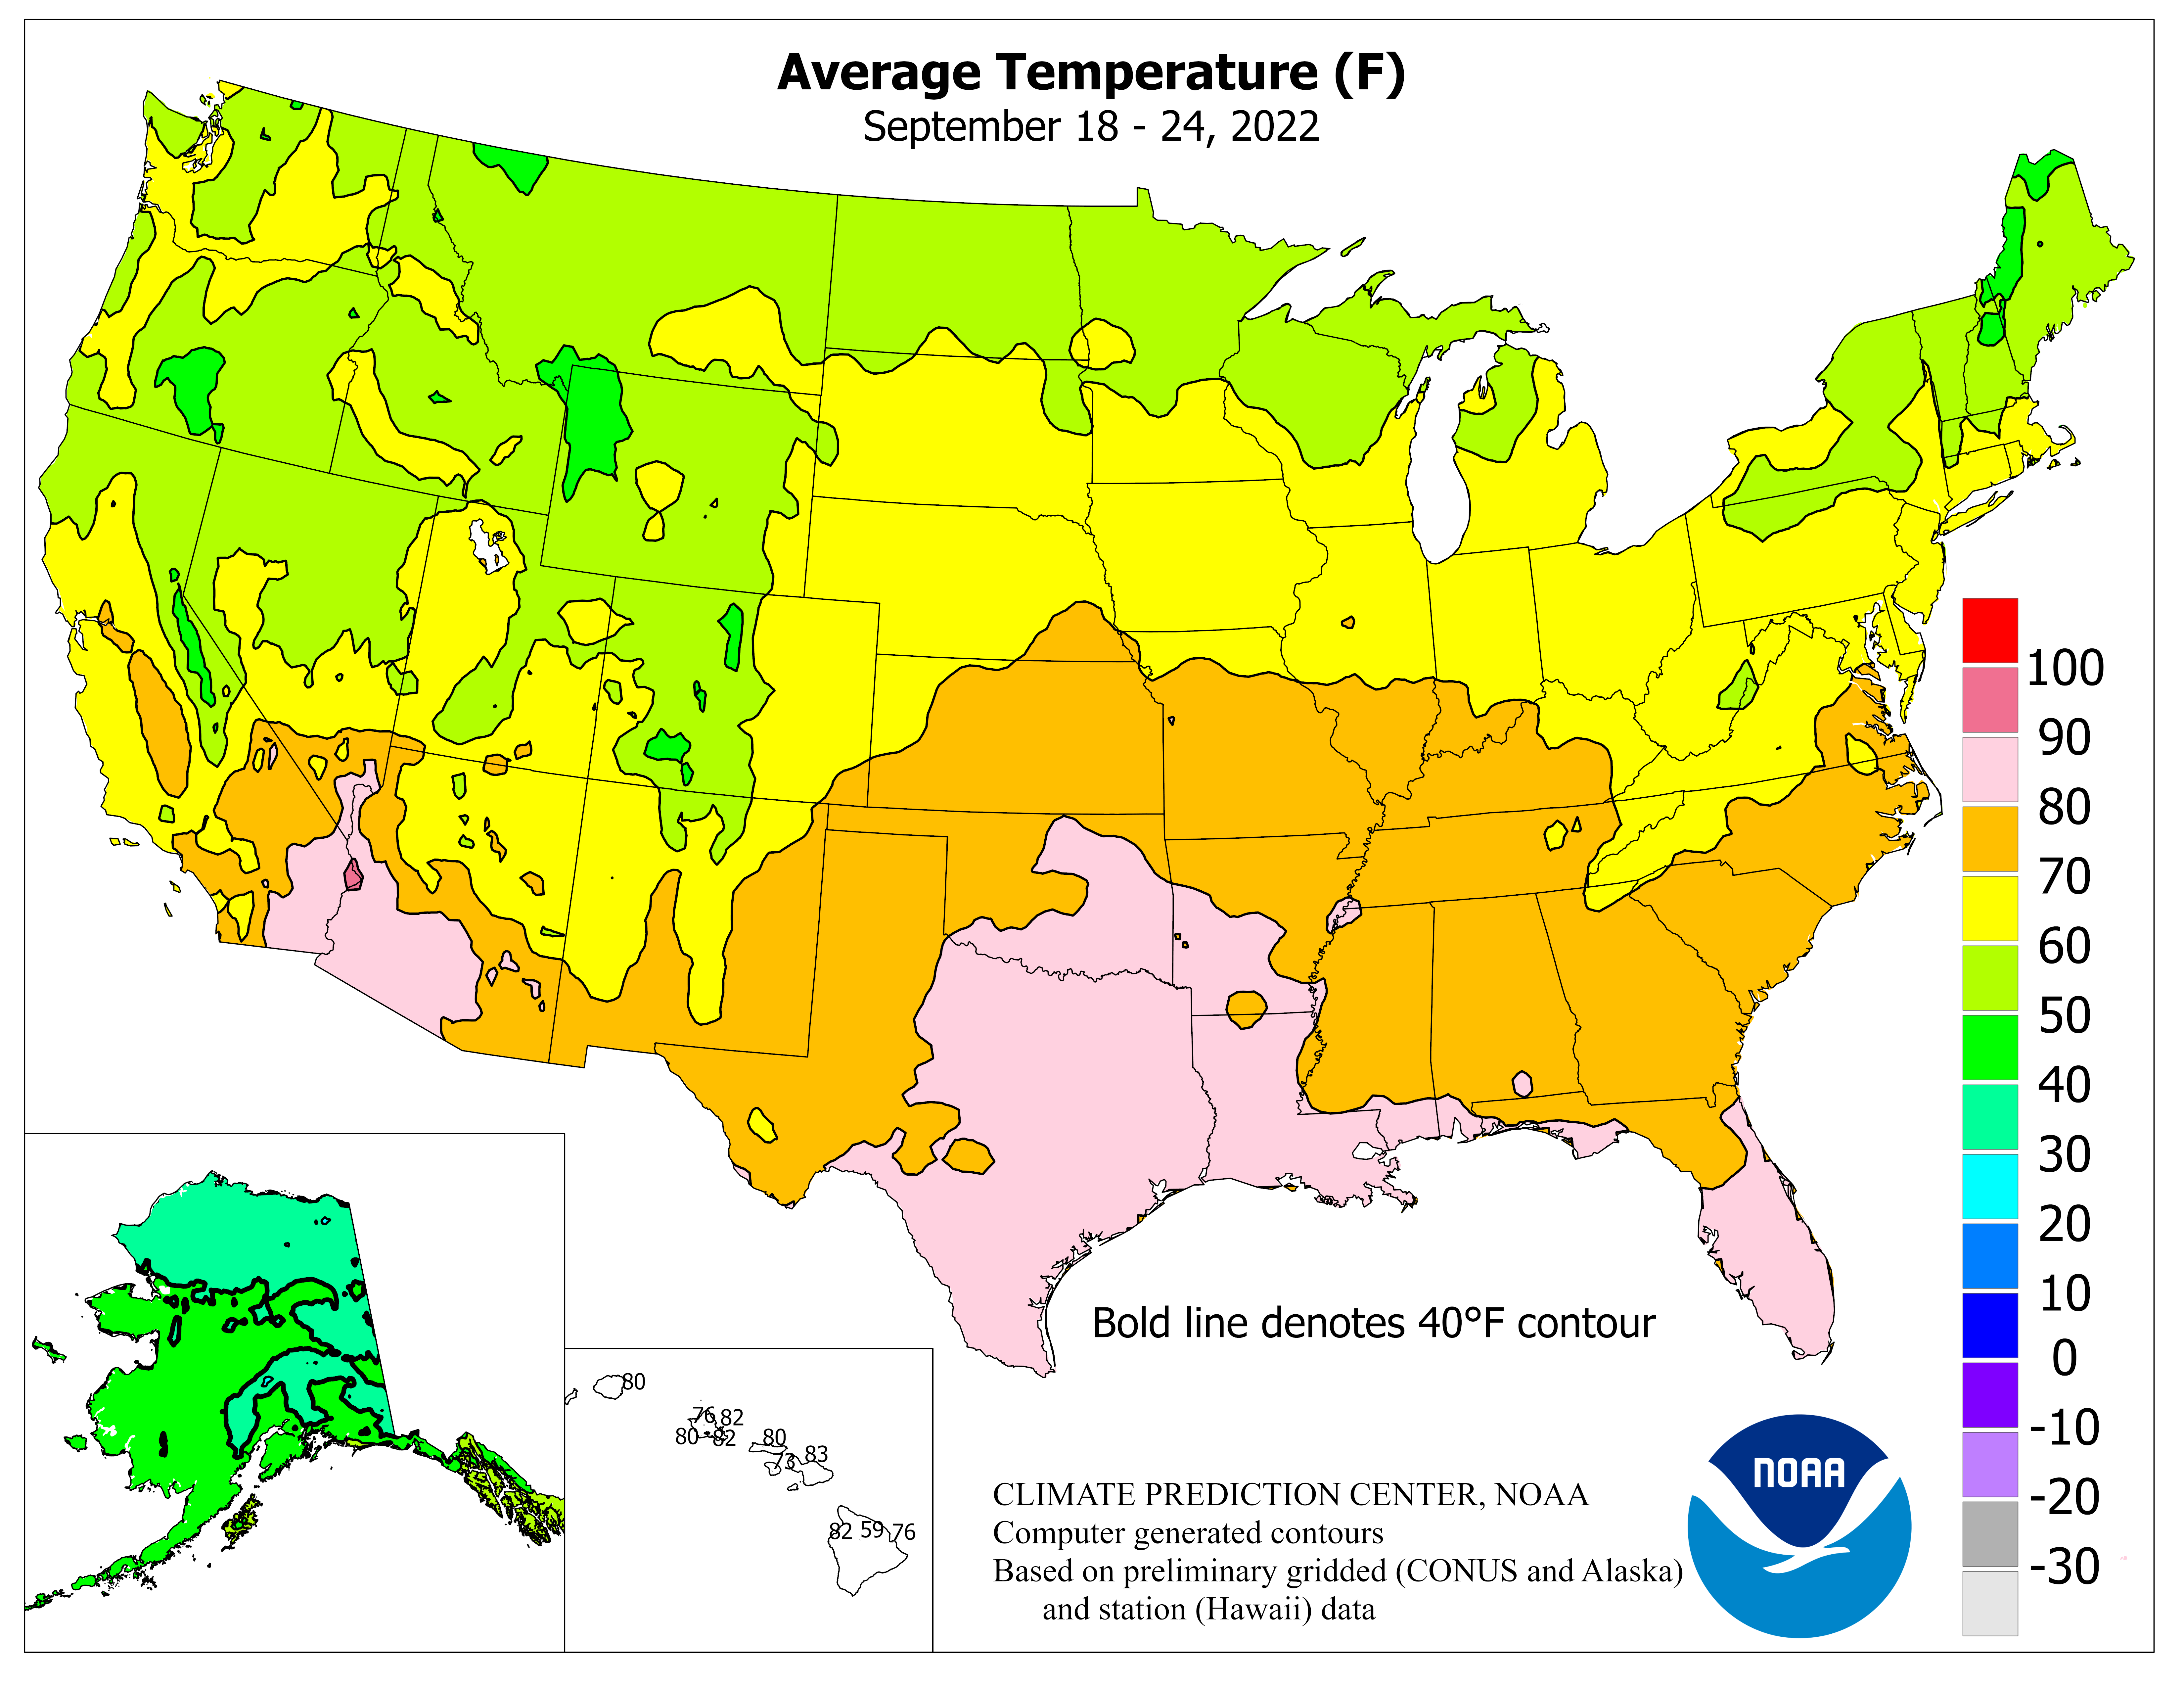
USA Climate Map | Printable Map Of USA
US Temperature Map - United States Maps
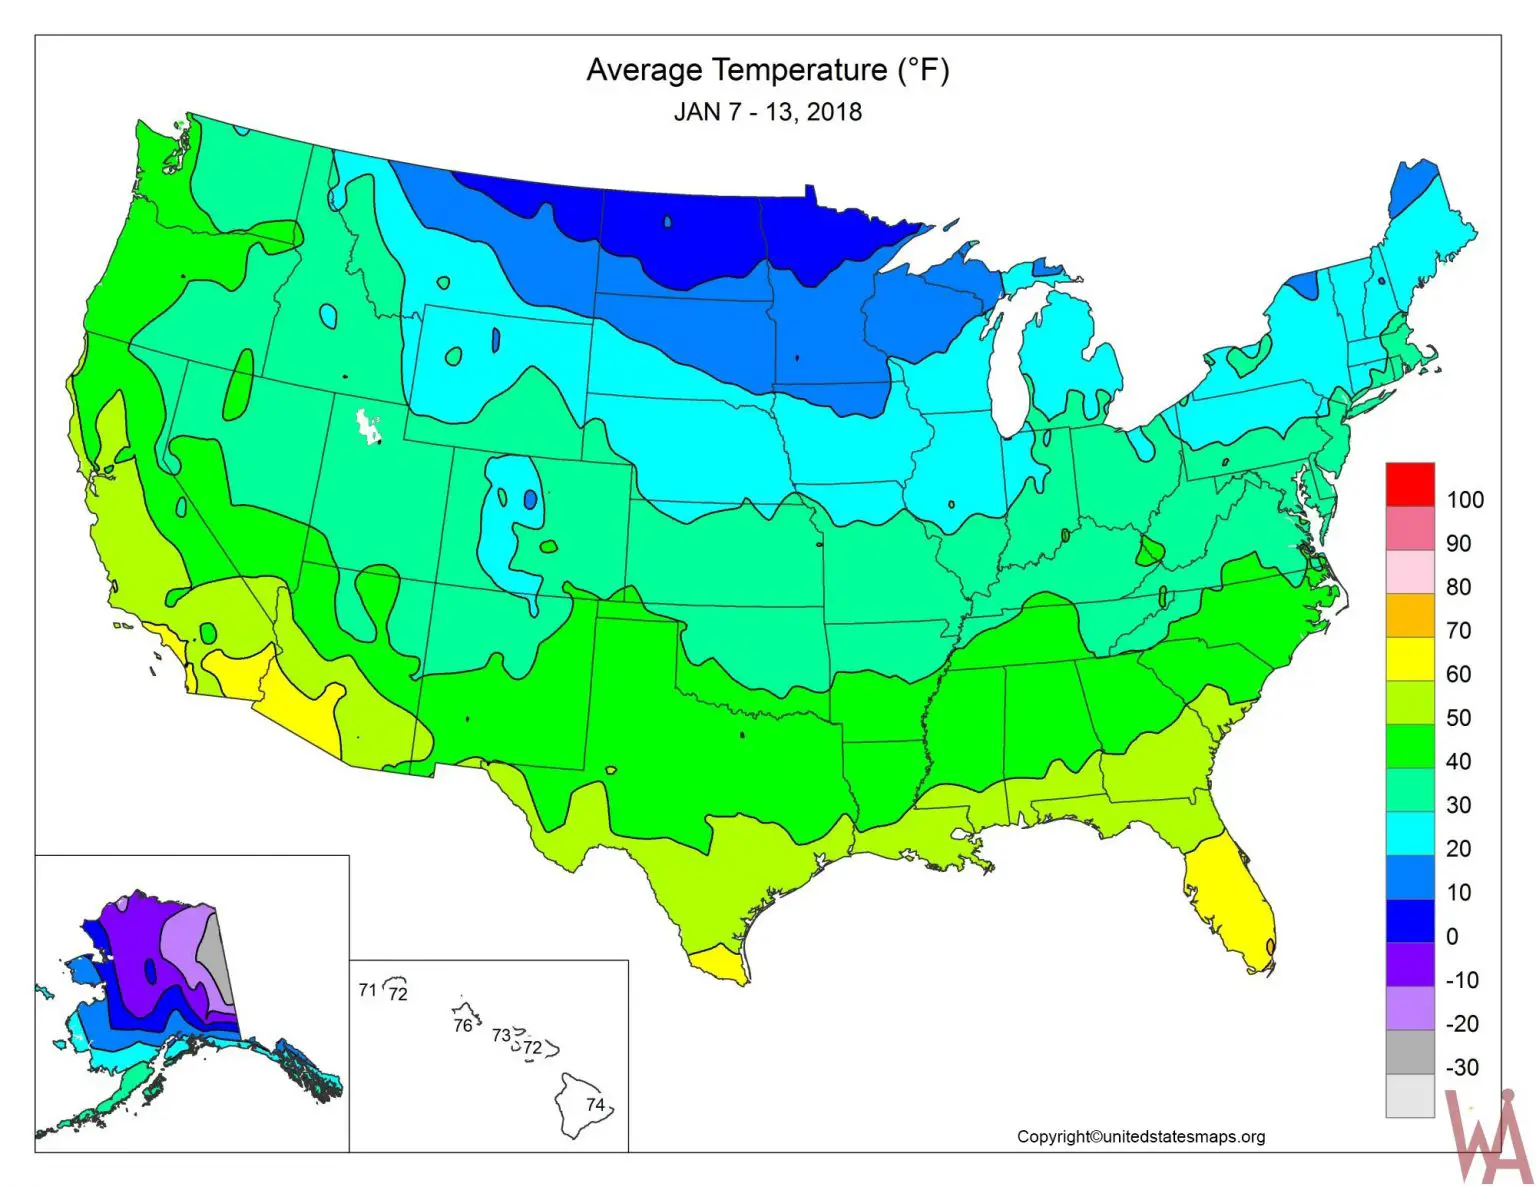
US Temperature Map - United States Maps
A Window Into The Weather: Understanding National Temperature Maps
A Window Into The Weather: Understanding National Temperature Maps ...
United States Current Temperatures | Temperature Maps | Weather Underground

United States Current Temperatures | Temperature Maps | Weather Underground
Temperature Maps | SMU Dedman College Of Humanites & Sciences

Temperature Maps | SMU Dedman College of Humanites & Sciences
Live US Temperature Map | Real-Time Weather Across The Contiguous
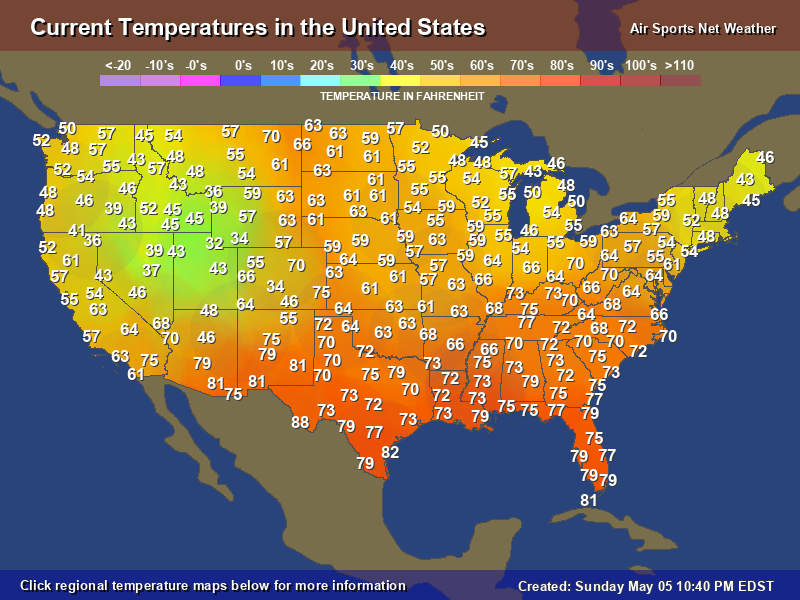
Live US Temperature Map | Real-Time Weather Across the Contiguous ...
US Temperature Map - GIS Geography
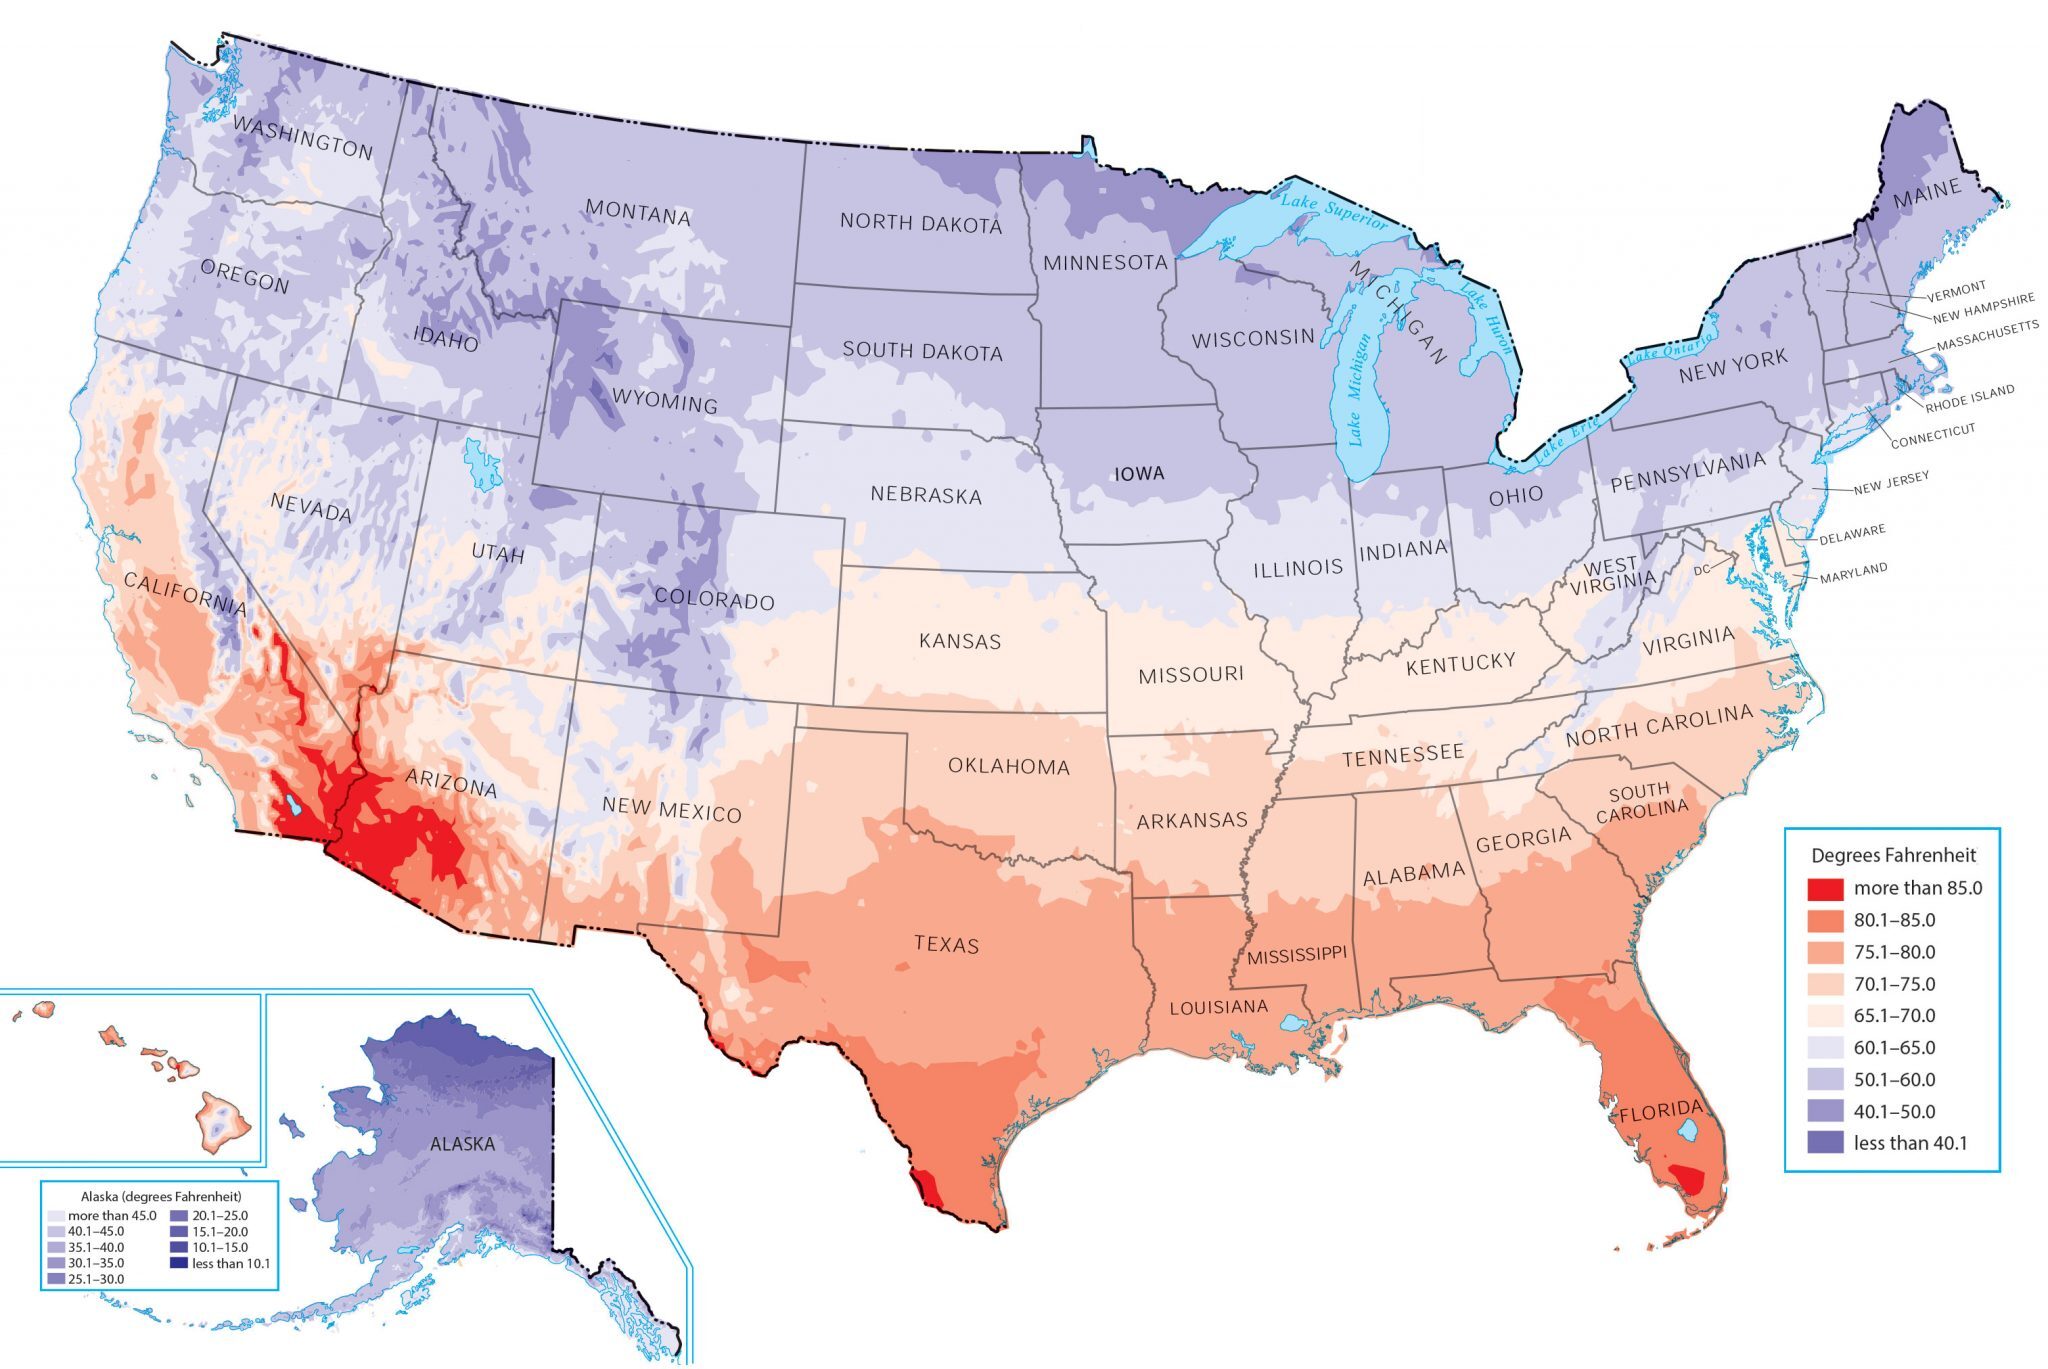
US Temperature Map - GIS Geography
Us Weather Map Temperature Highs
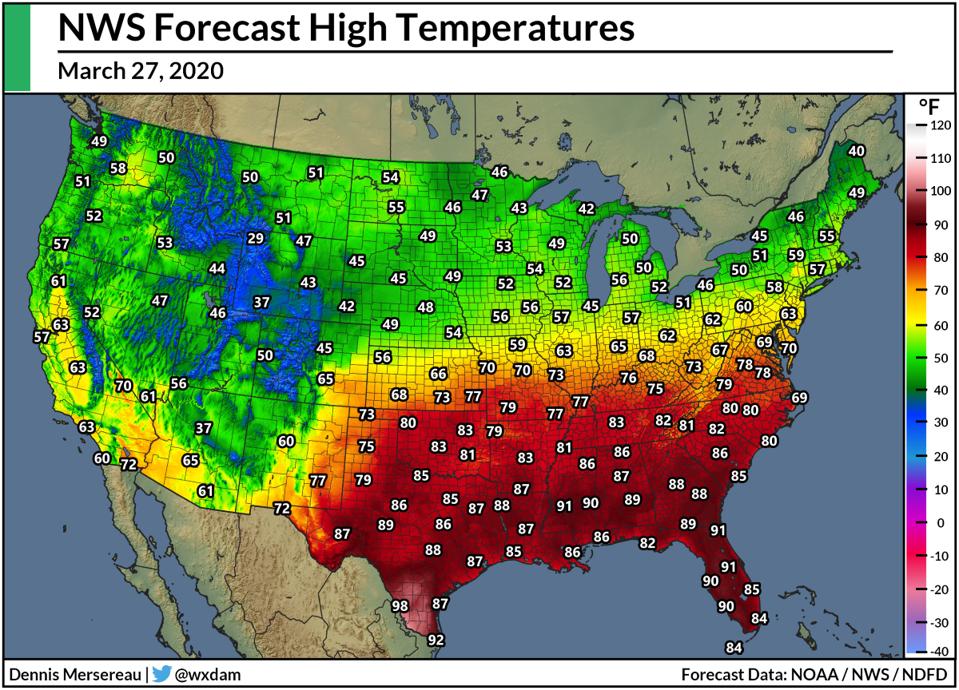
Us Weather Map Temperature Highs
US Current Temperatures (Celsius)

US Current Temperatures (Celsius)
Weather Heat Map United States - Printable Map
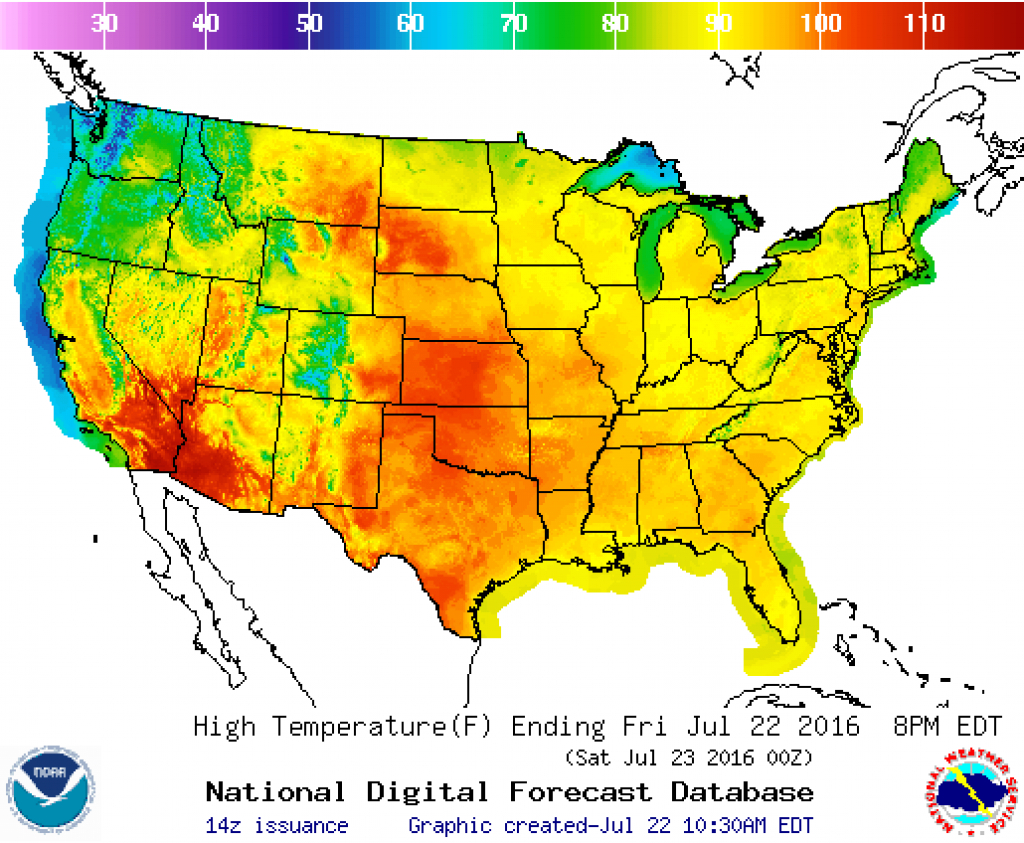
Weather Heat Map United States - Printable Map
