Ultimate Guide to Using US States Map Images for Professional Projects
In the era of data‑driven storytelling, a clear and accurate US states map image is a cornerstone for reports, dashboards, marketing collateral, and educational materials. Whether you’re a business analyst, a digital marketer, or an educator, choosing the right map image—along with understanding its nuances—ensures that your visualizations are both engaging and credible.
1. Selecting the Correct Map Projection
Choosing an appropriate projection—such as the Albers Equal‑Area or Lambert Conformal Conic—maintains area proportions and minimizes distortion, which is critical for demographic analyses or resource allocation studies that rely on accurate land area calculations.
2. Opting for High‑Resolution Vector Images
Vector formats (SVG, EPS) scale cleanly across print, web, and large‑screen presentations. Unlike raster images, vectors preserve edge clarity and allow you to adjust colors or add annotations without compromising quality.
3. Customizing State Highlighting for Data Visualization
By manipulating fill colors, borders, or opacity, you can emphasize states that meet specific criteria—such as sales thresholds or survey responses—making complex datasets instantly digestible.
4. Incorporating Interactive Elements for Web Deployments
Embedding SVG maps into web pages permits hover tooltips, click‑through links, and dynamic data binding via JavaScript libraries like D3.js, enhancing user engagement and information depth.
5. Ensuring Color Accessibility and Contrast Compliance
Adhering to WCAG 2.1 guidelines for color contrast and using colorblind‑friendly palettes (e.g., ColorBrewer’s “Spectral”) guarantees that your map remains inclusive to all viewers.
6. Managing Licensing and Attribution Requirements
Many public‑domain map sources, such as the US Census Bureau’s TIGER/Line shapefiles, are free to use; however, commercial or modified versions may require attribution or a license fee—reviewing these terms prevents legal pitfalls.
7. Integrating State Boundary Data with GIS Platforms
For advanced spatial analysis, exporting boundary data in GeoJSON or shapefile formats enables seamless integration with GIS tools like ArcGIS or QGIS, supporting layered analyses and geoprocessing tasks.
8. Adding Historical or Thematic Layers for Context
Overlaying historical borders, voting precincts, or economic zones provides richer context for temporal studies, political science research, or market trend analyses.
9. Automating Updates with Version‑Controlled Repositories
Storing your map assets in a Git repository, coupled with automated build scripts, ensures that any state changes (e.g., new statehood or boundary adjustments) are propagated across all downstream documents and dashboards efficiently.
Printable Map Of The United States With State Names

Printable Map Of The United States With State Names
USA Map With States Vector Download
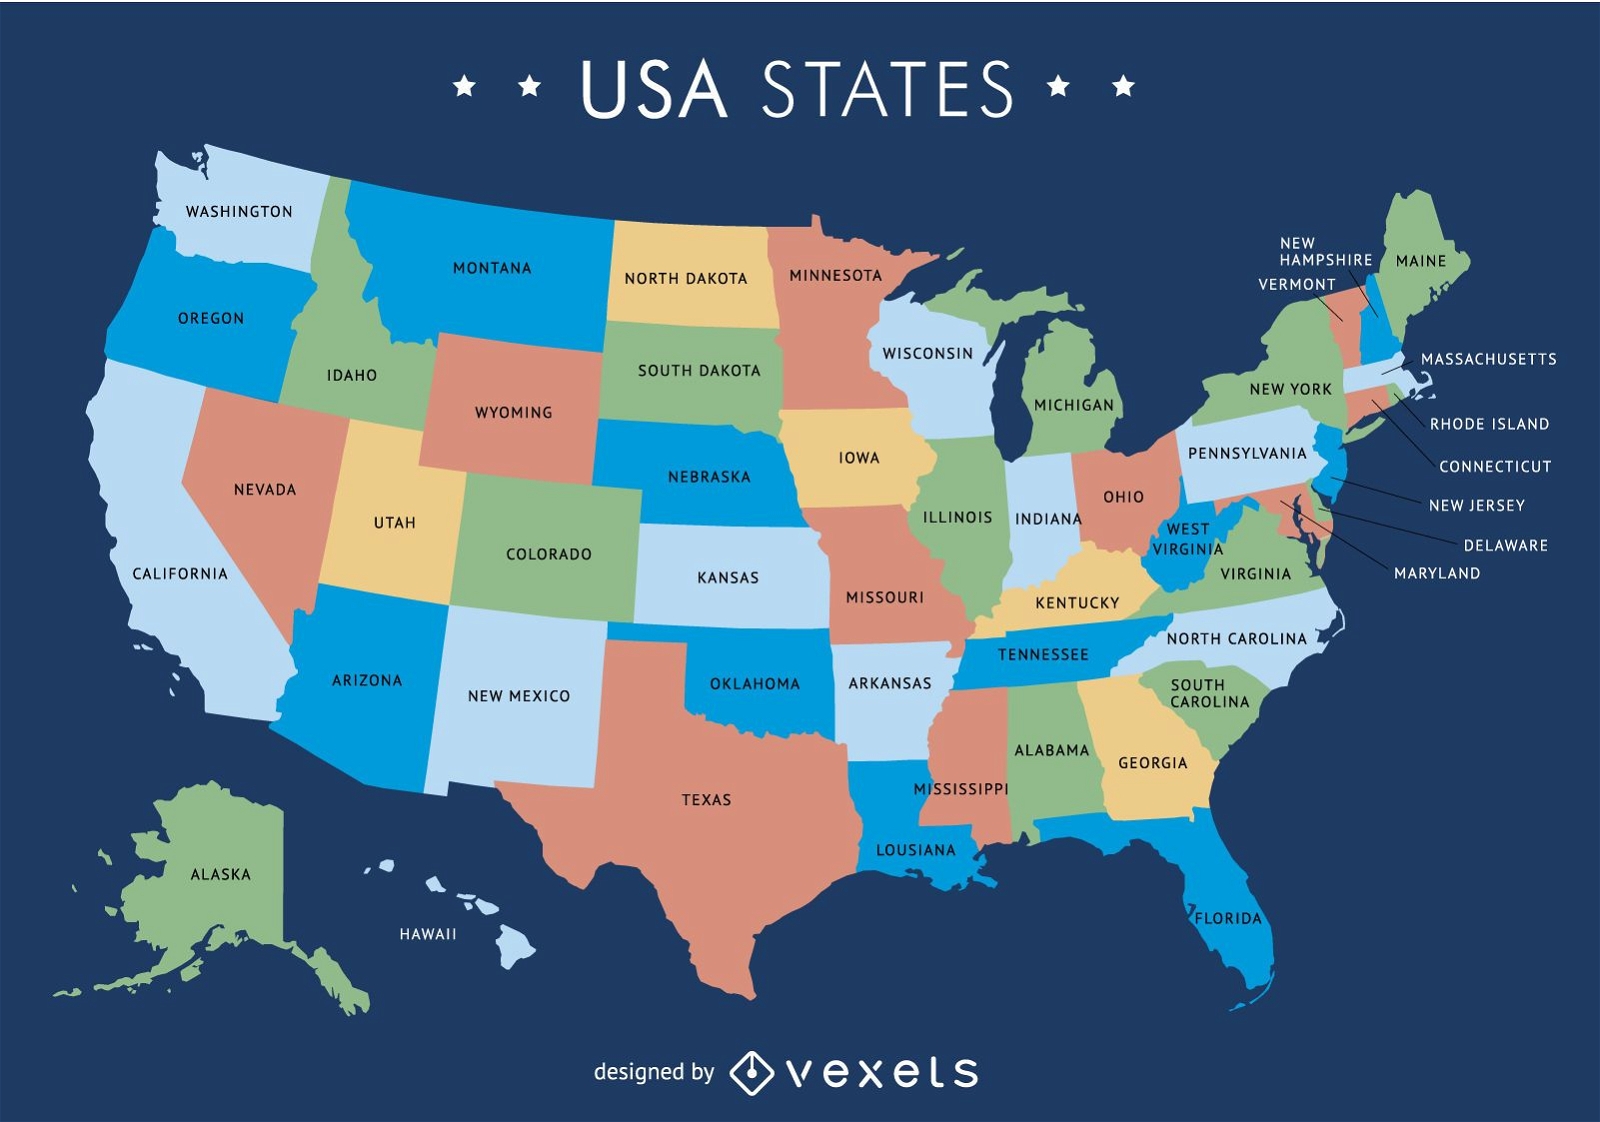
USA Map With States Vector Download
United States Printable Map USA Blank Printable Clip Art Maps

United States Printable Map USA Blank Printable Clip Art Maps
Printable High Resolution Us Map
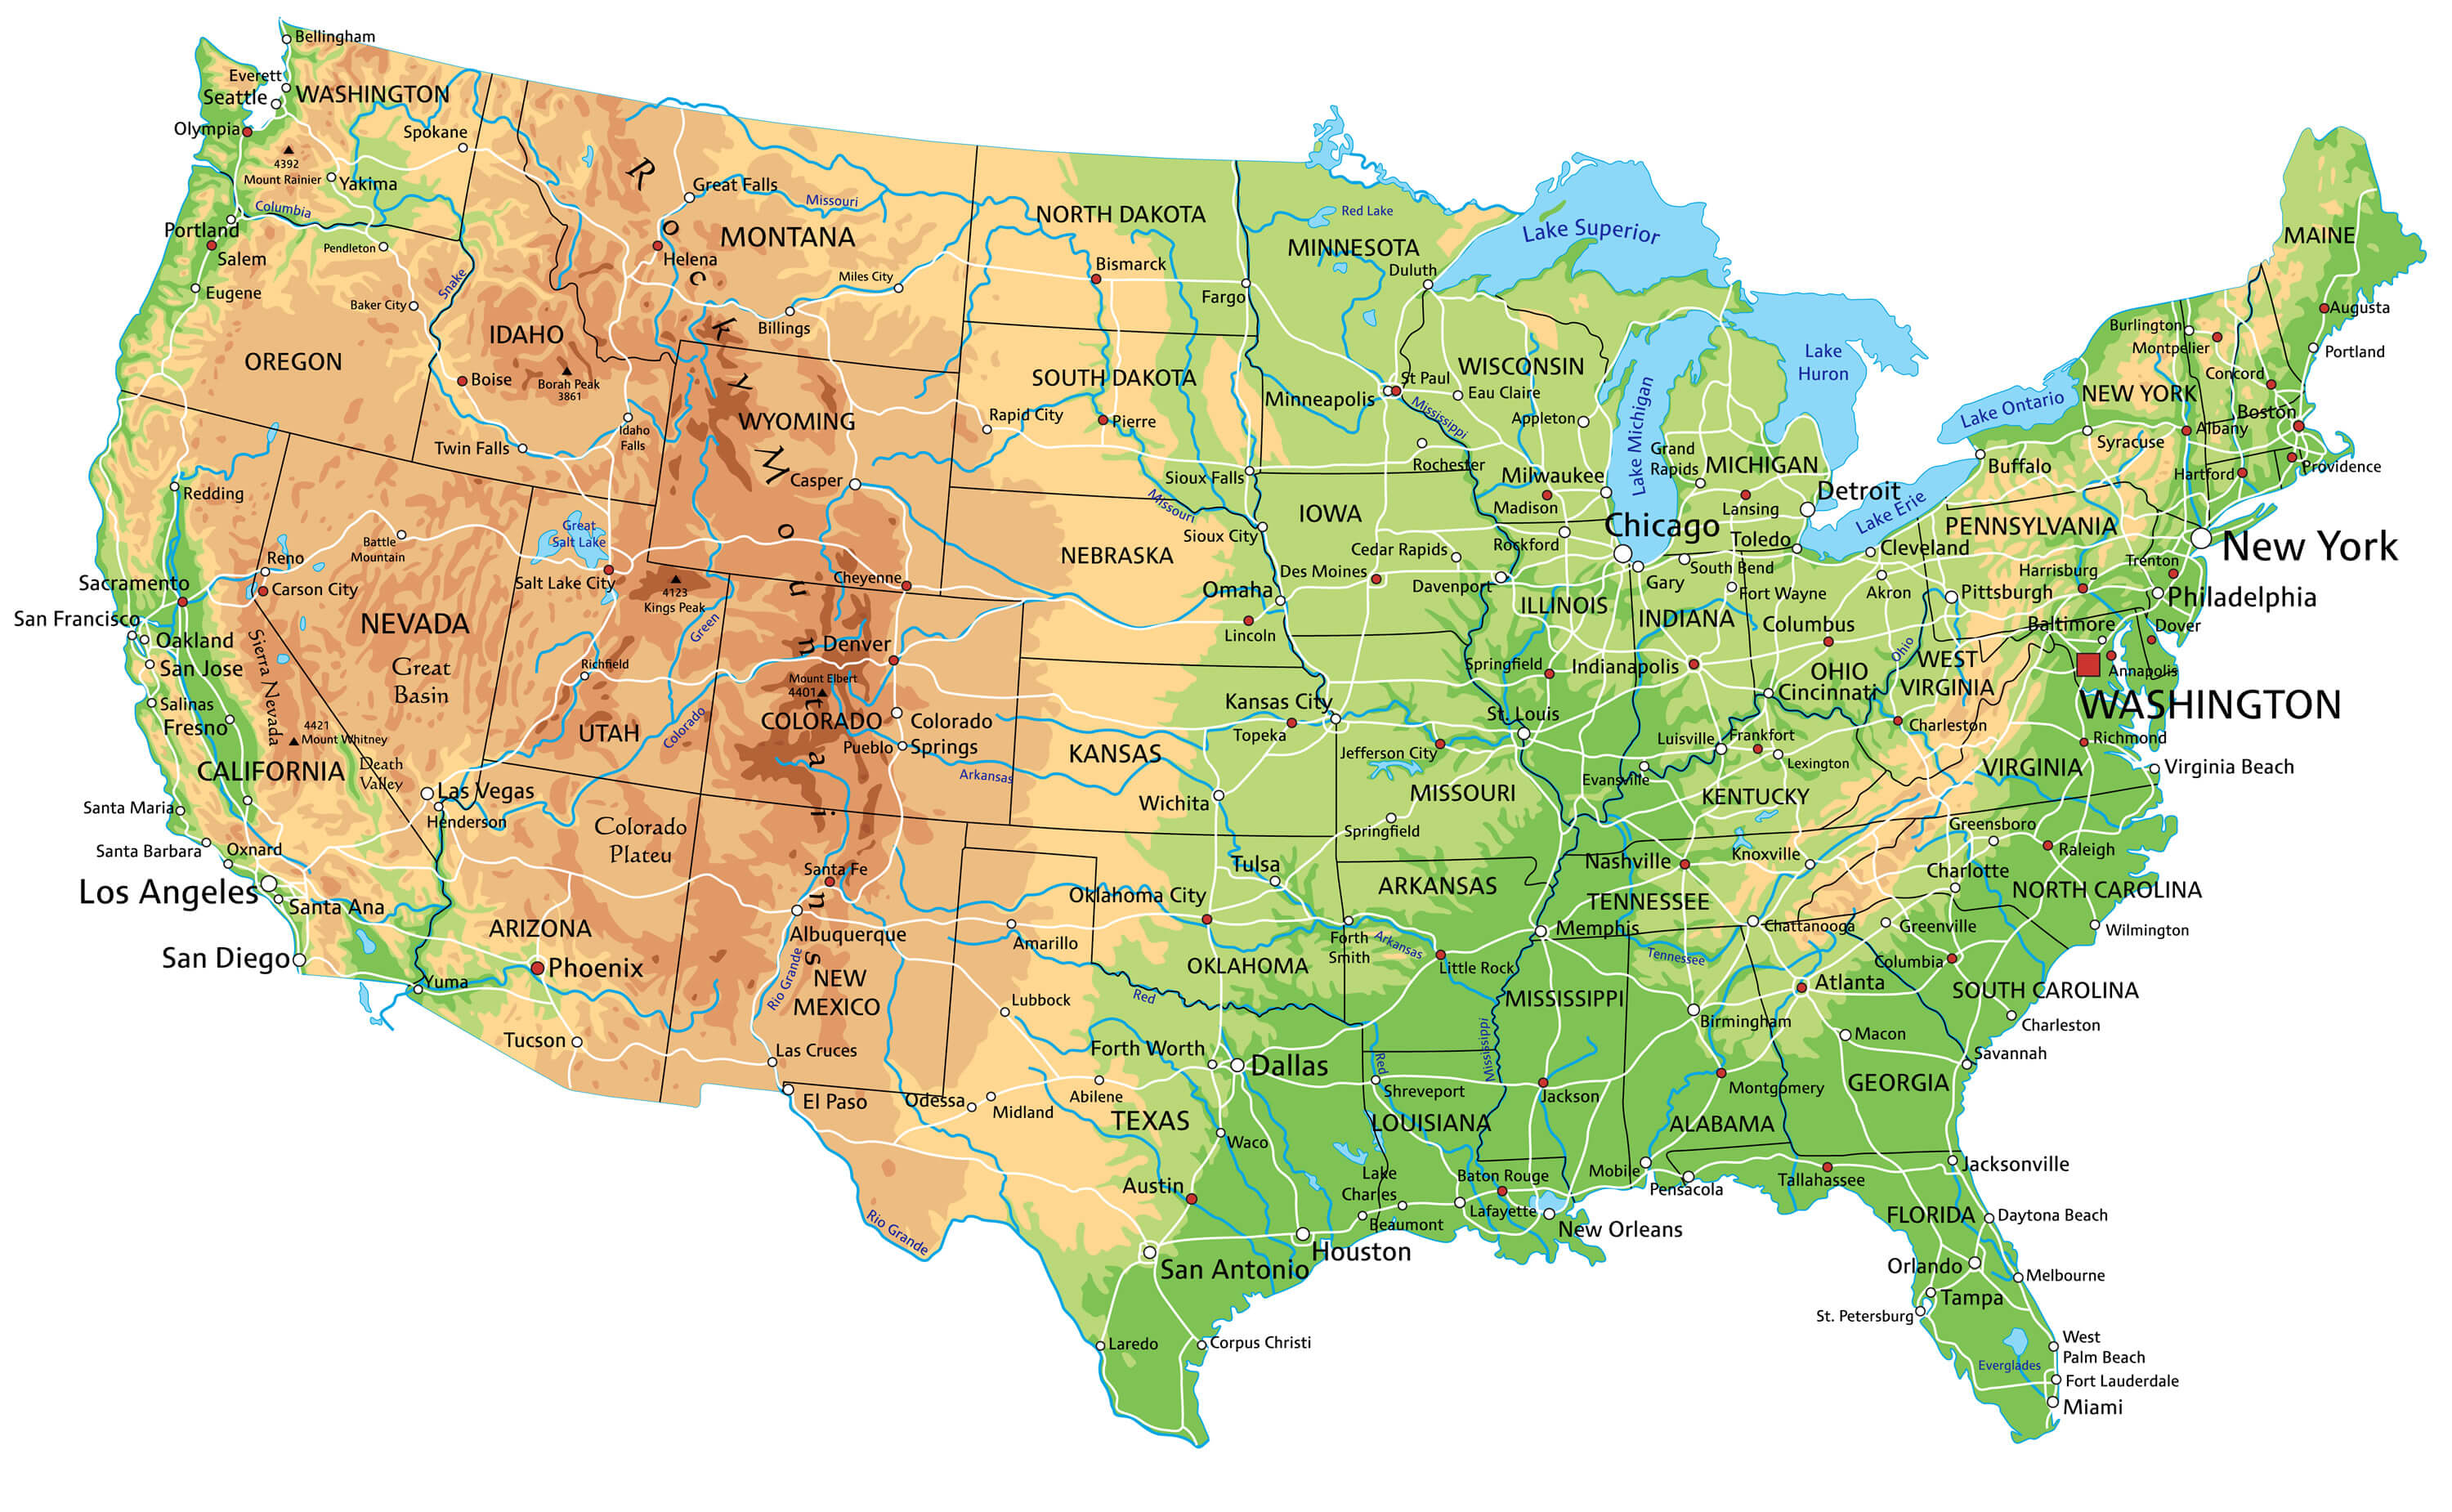
Printable High Resolution Us Map
Map Of The United States
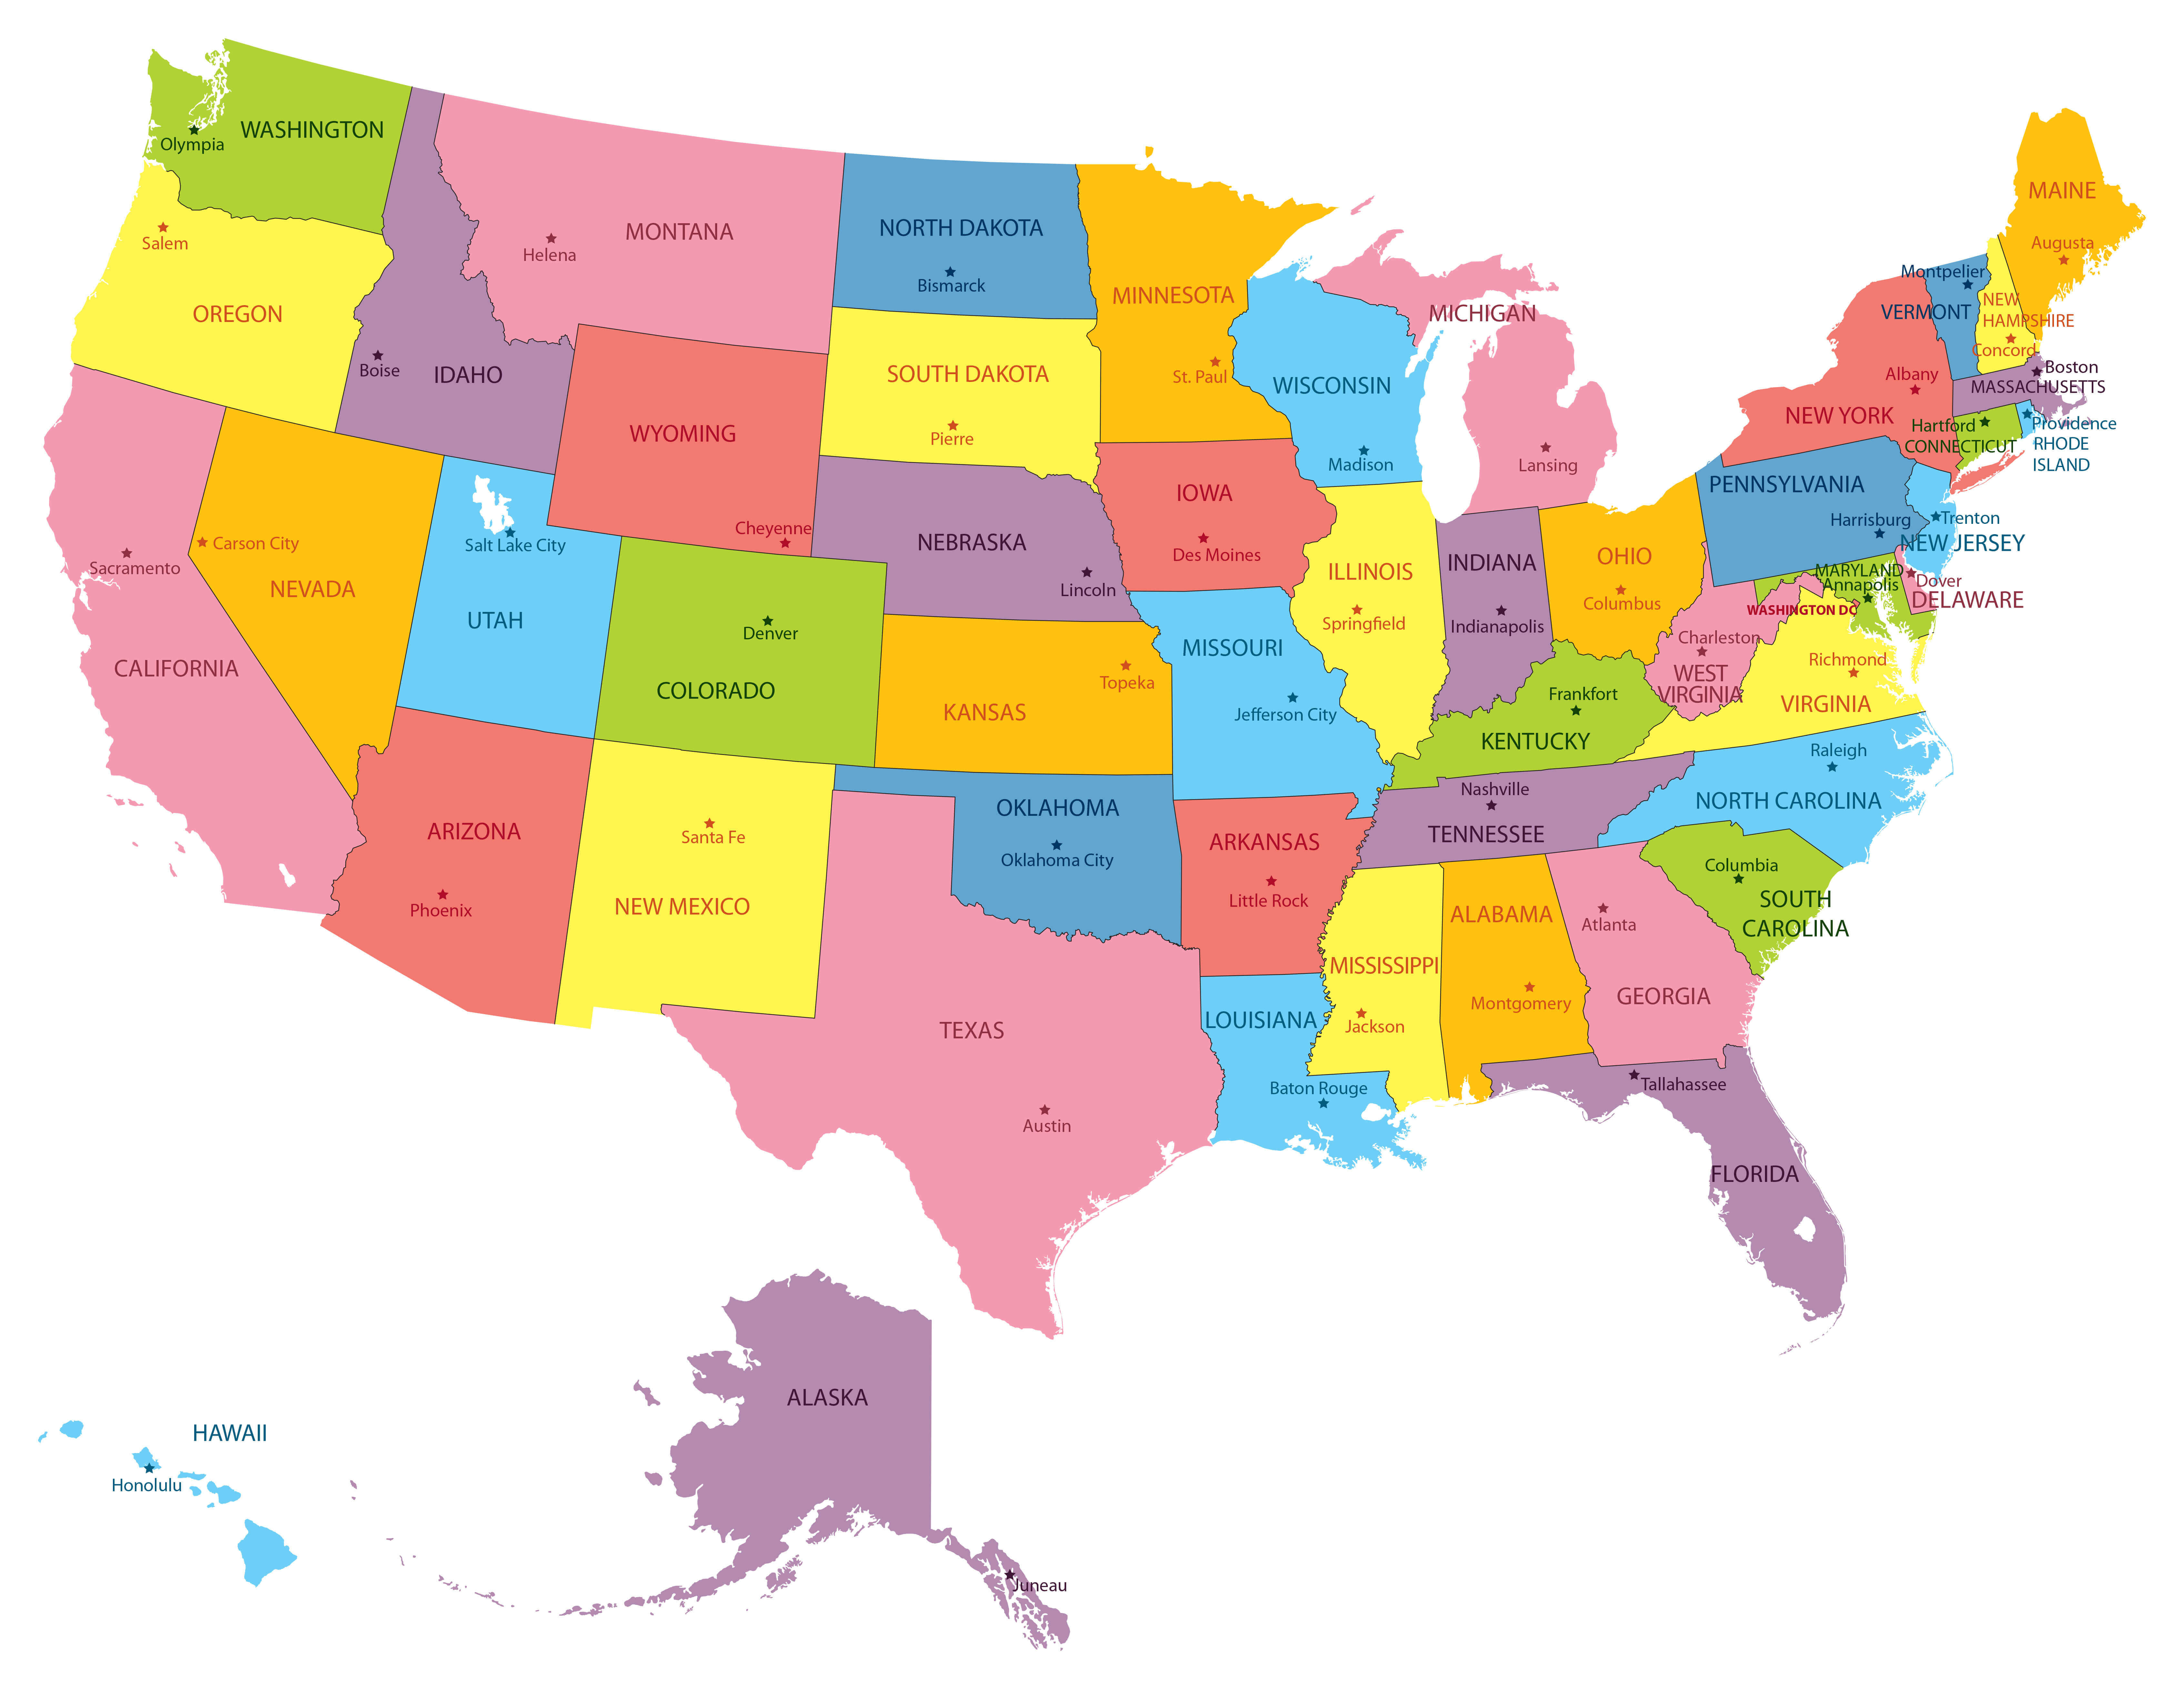
Map of the United States
Map Of United States
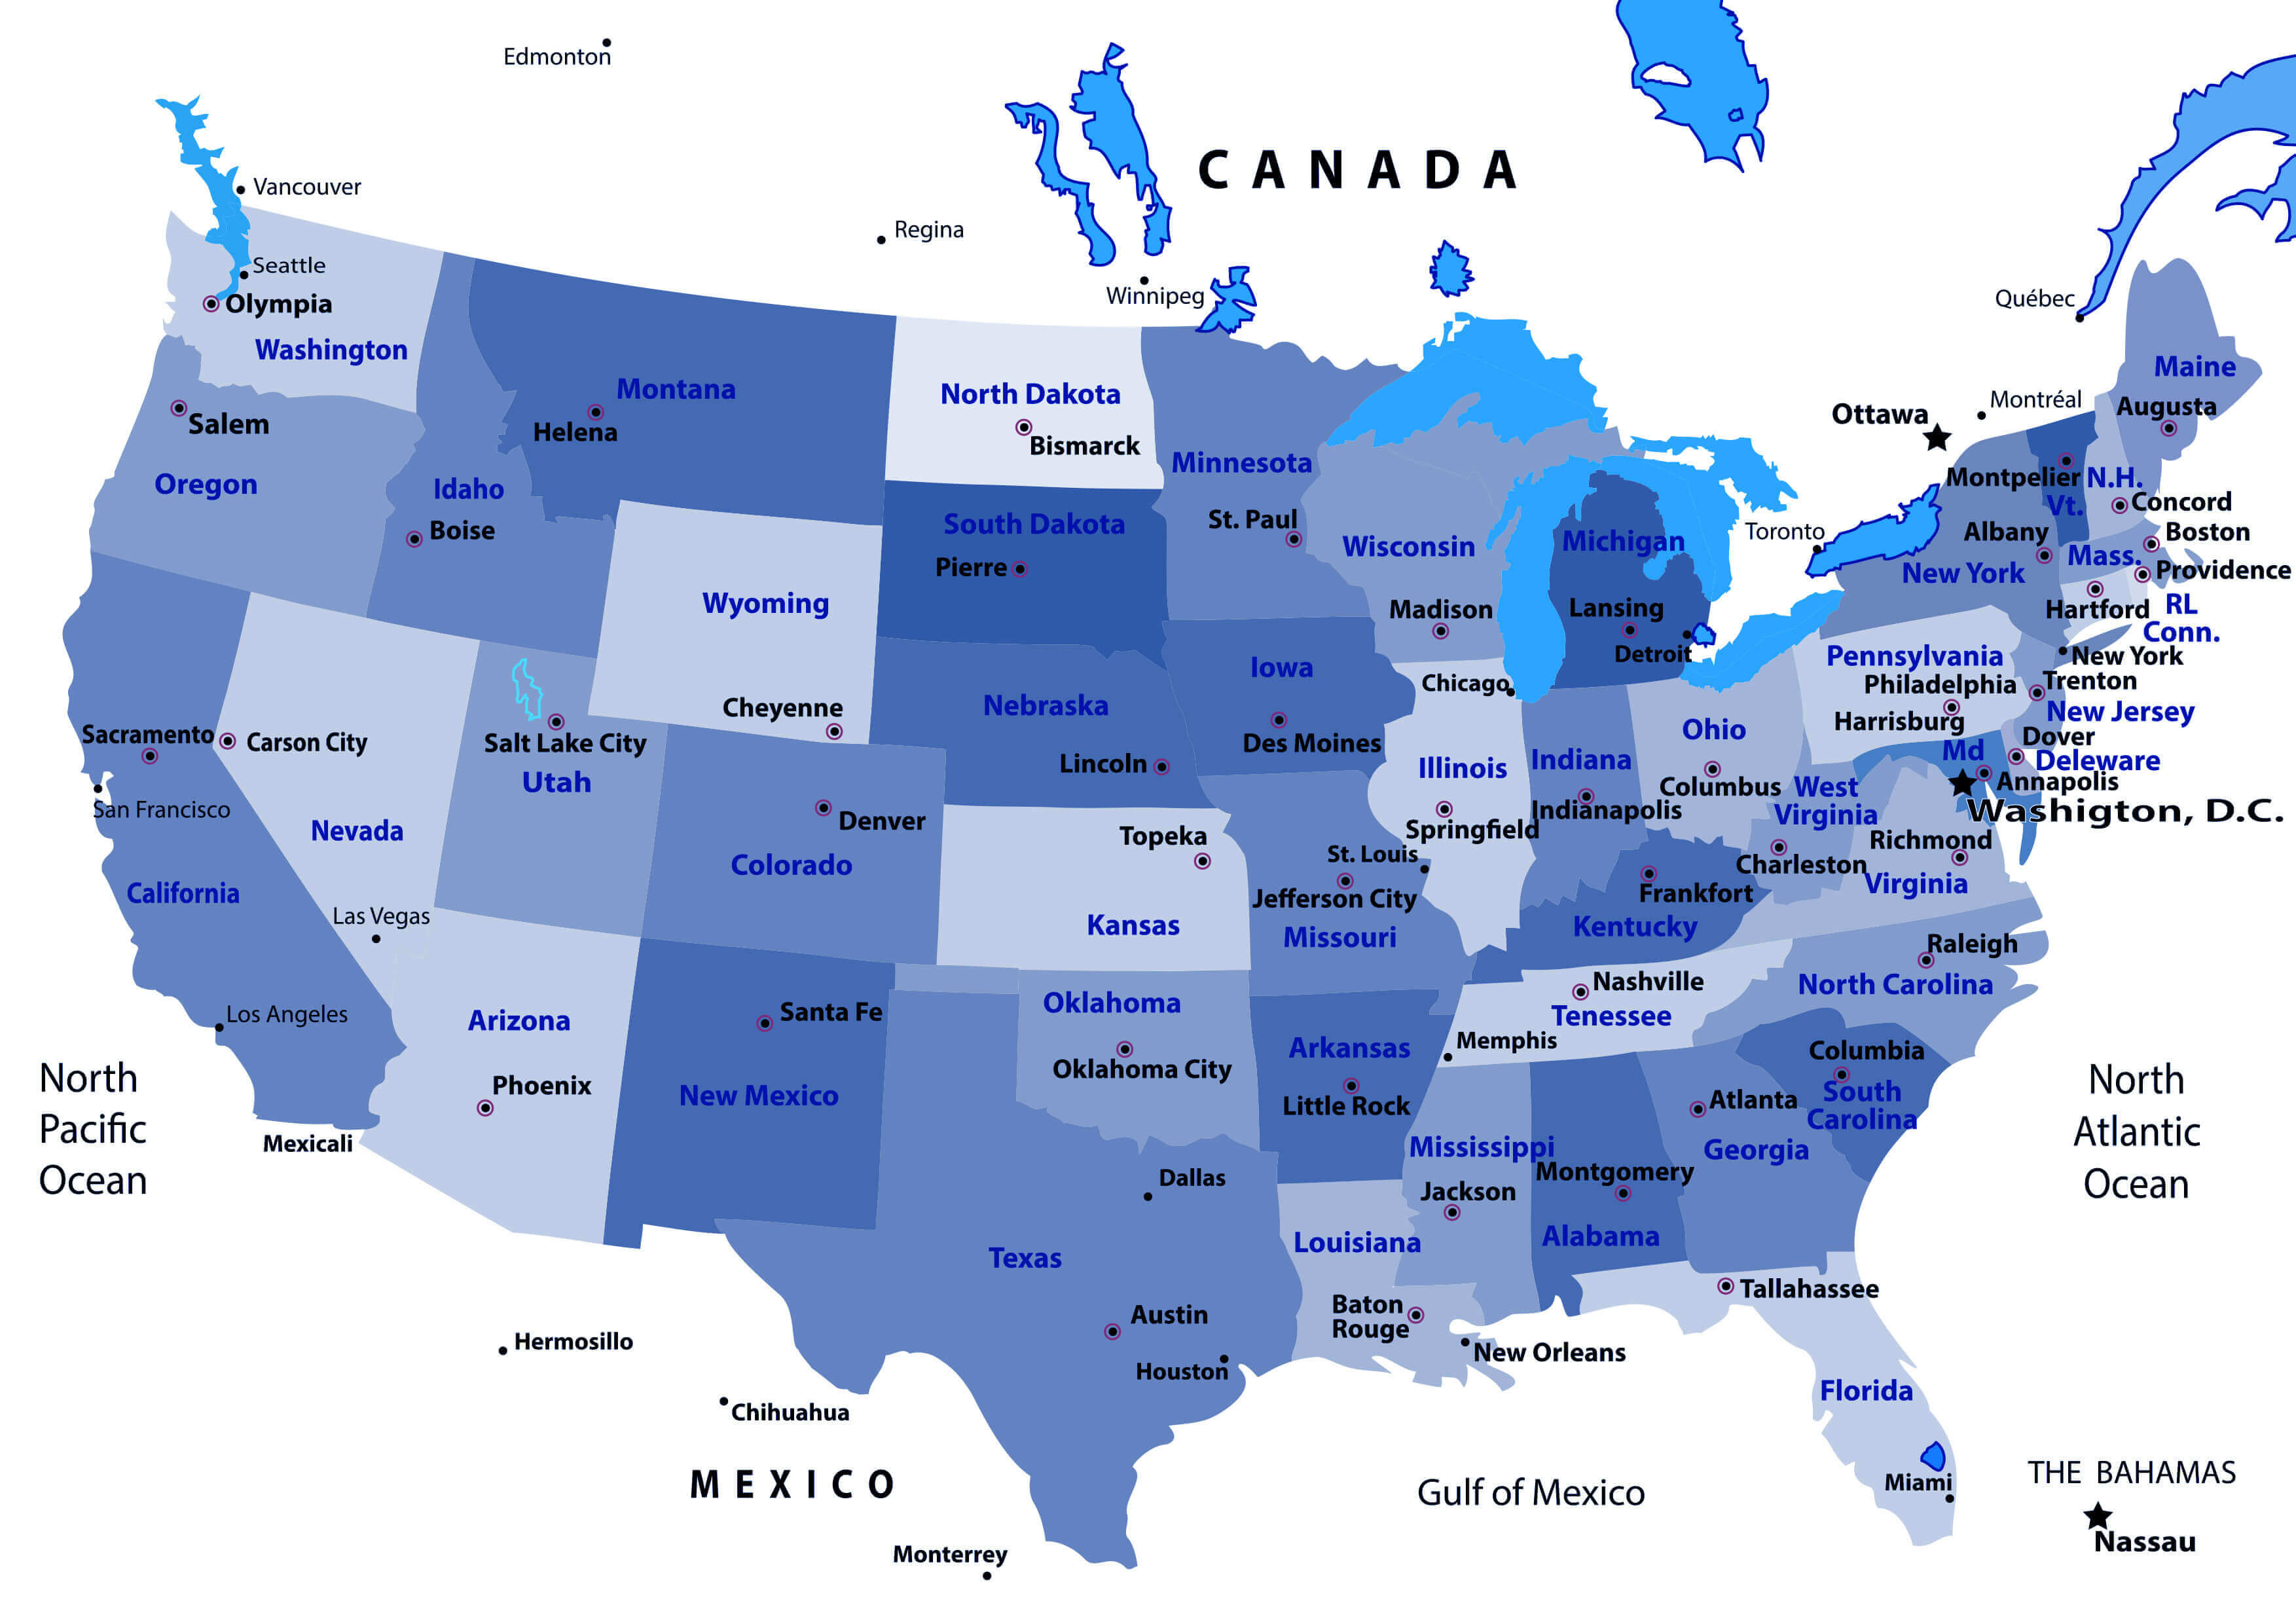
Map of United States
Large Political Map Of Usa Map Of Worldlarge Detailed Map Of Usa
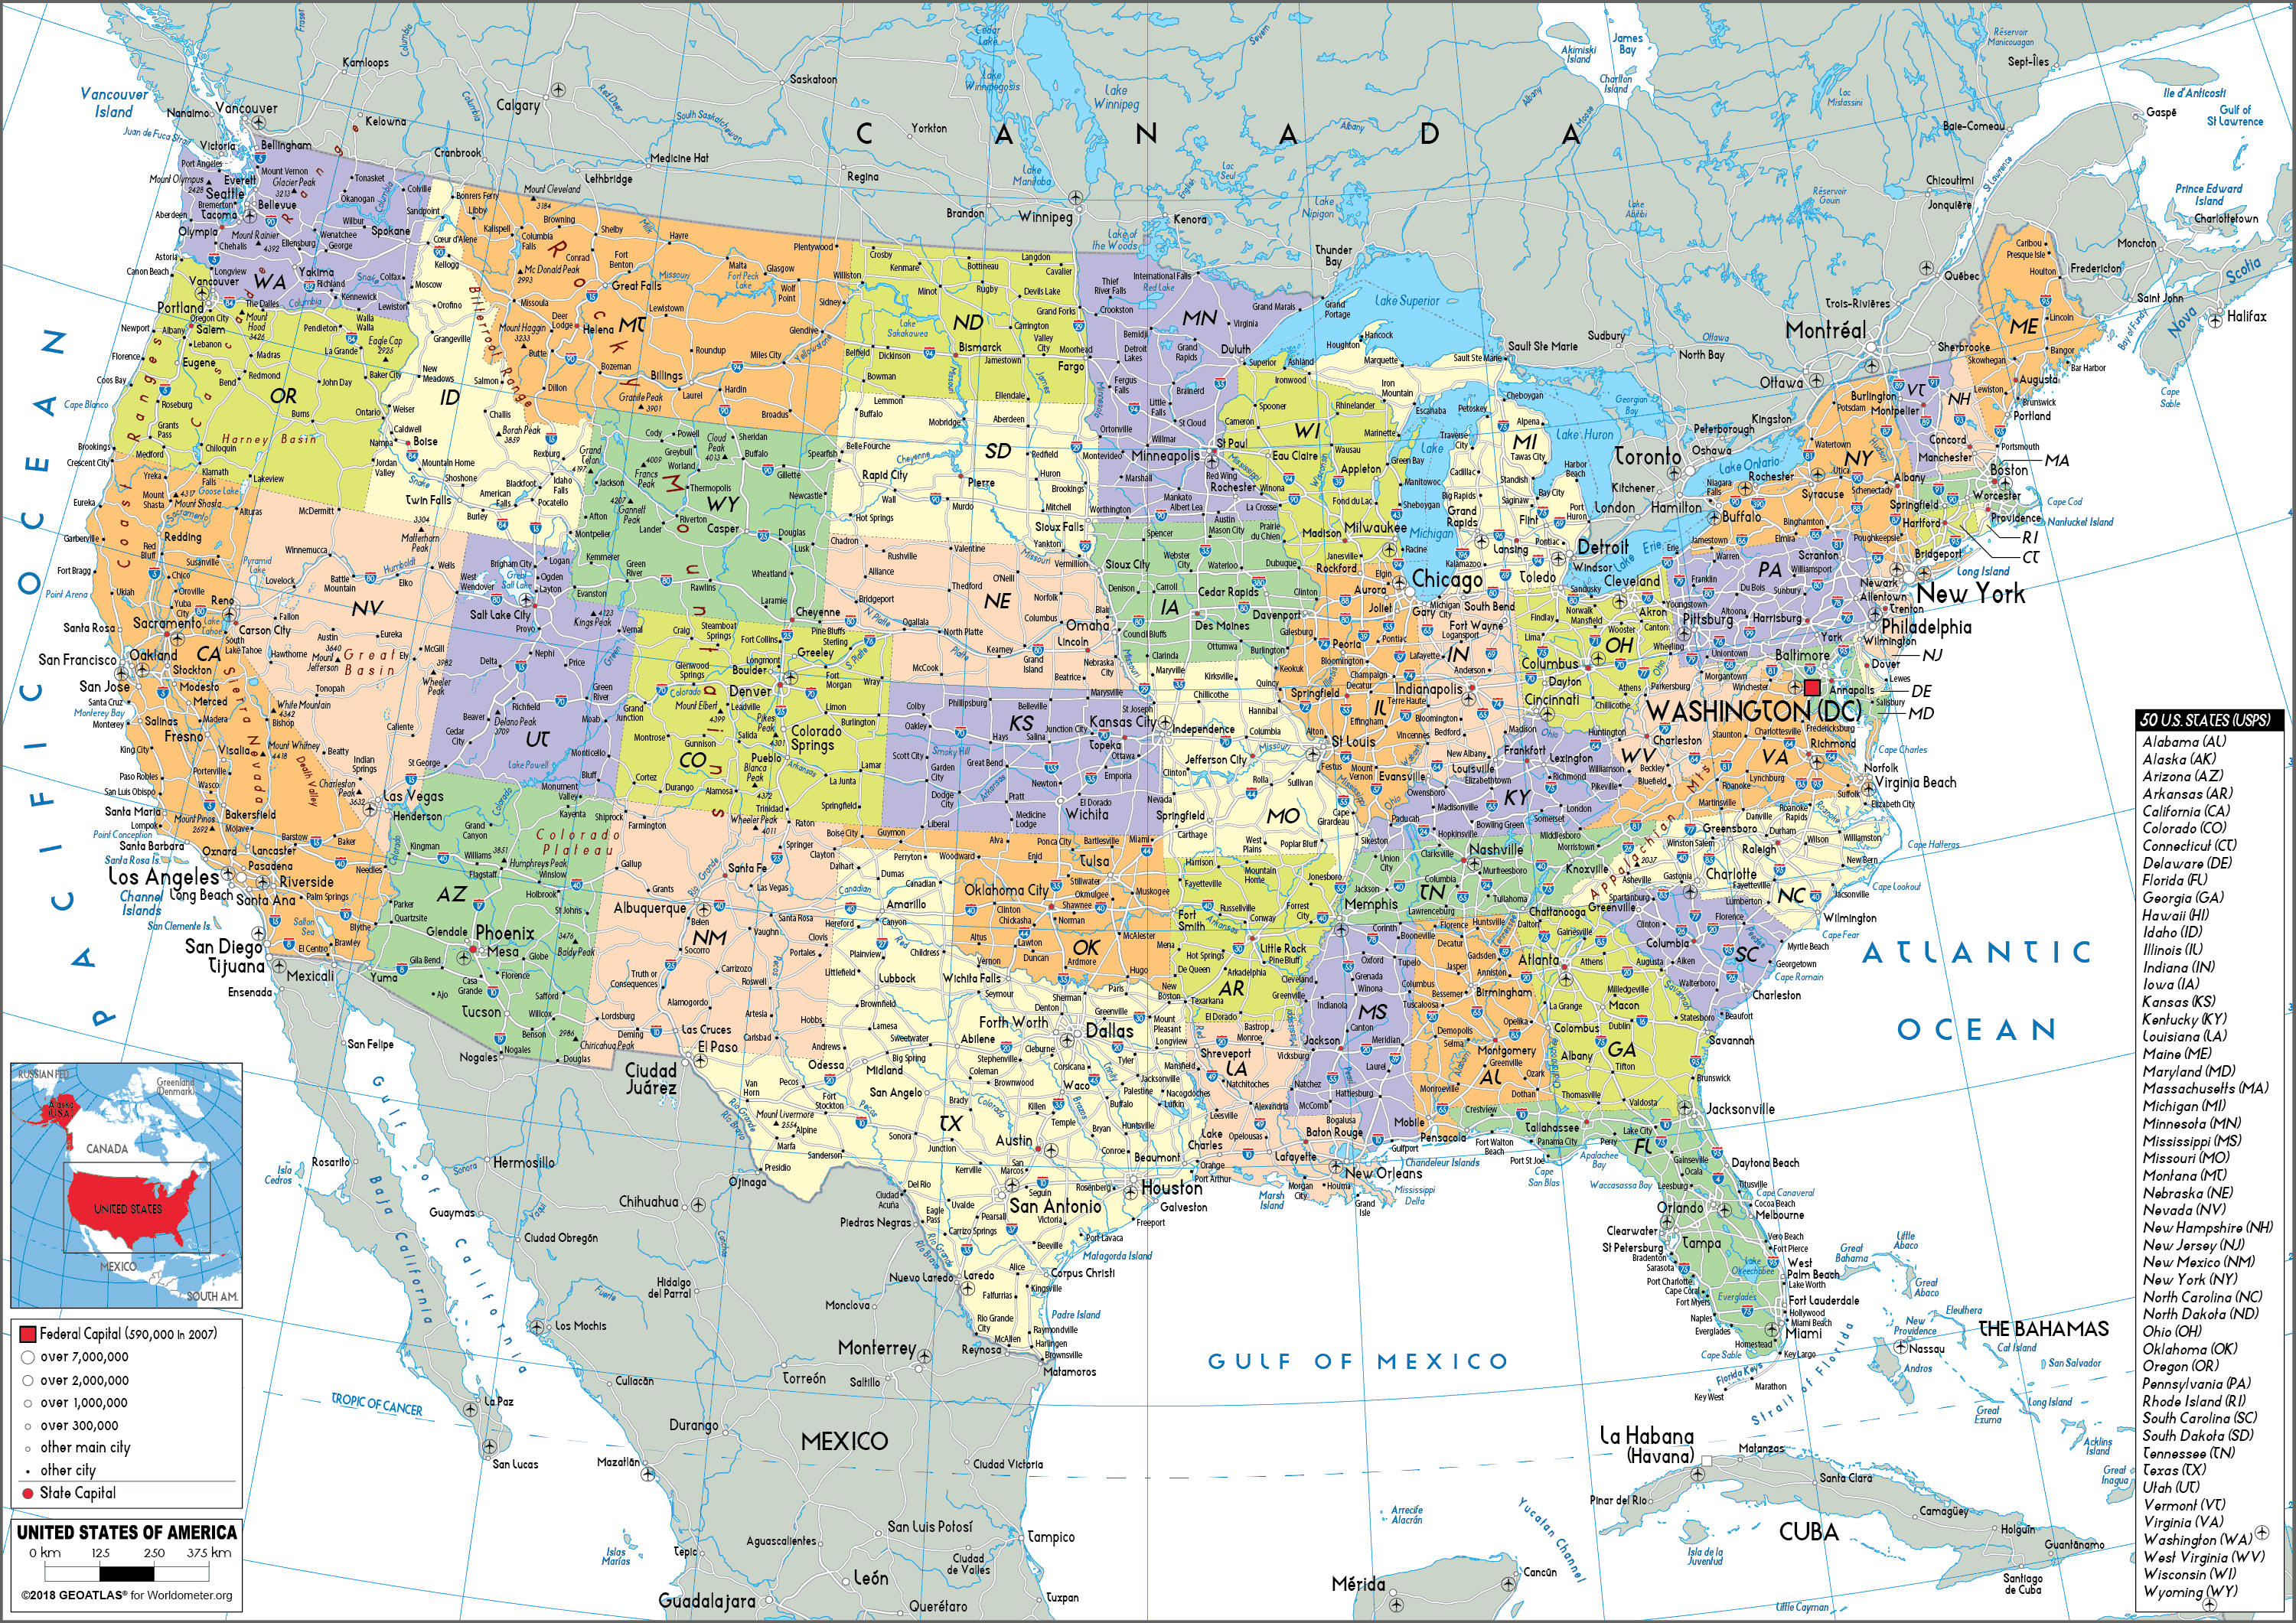
Large Political Map Of Usa Map Of Worldlarge Detailed Map Of Usa
Usa Map With Cities And Highways
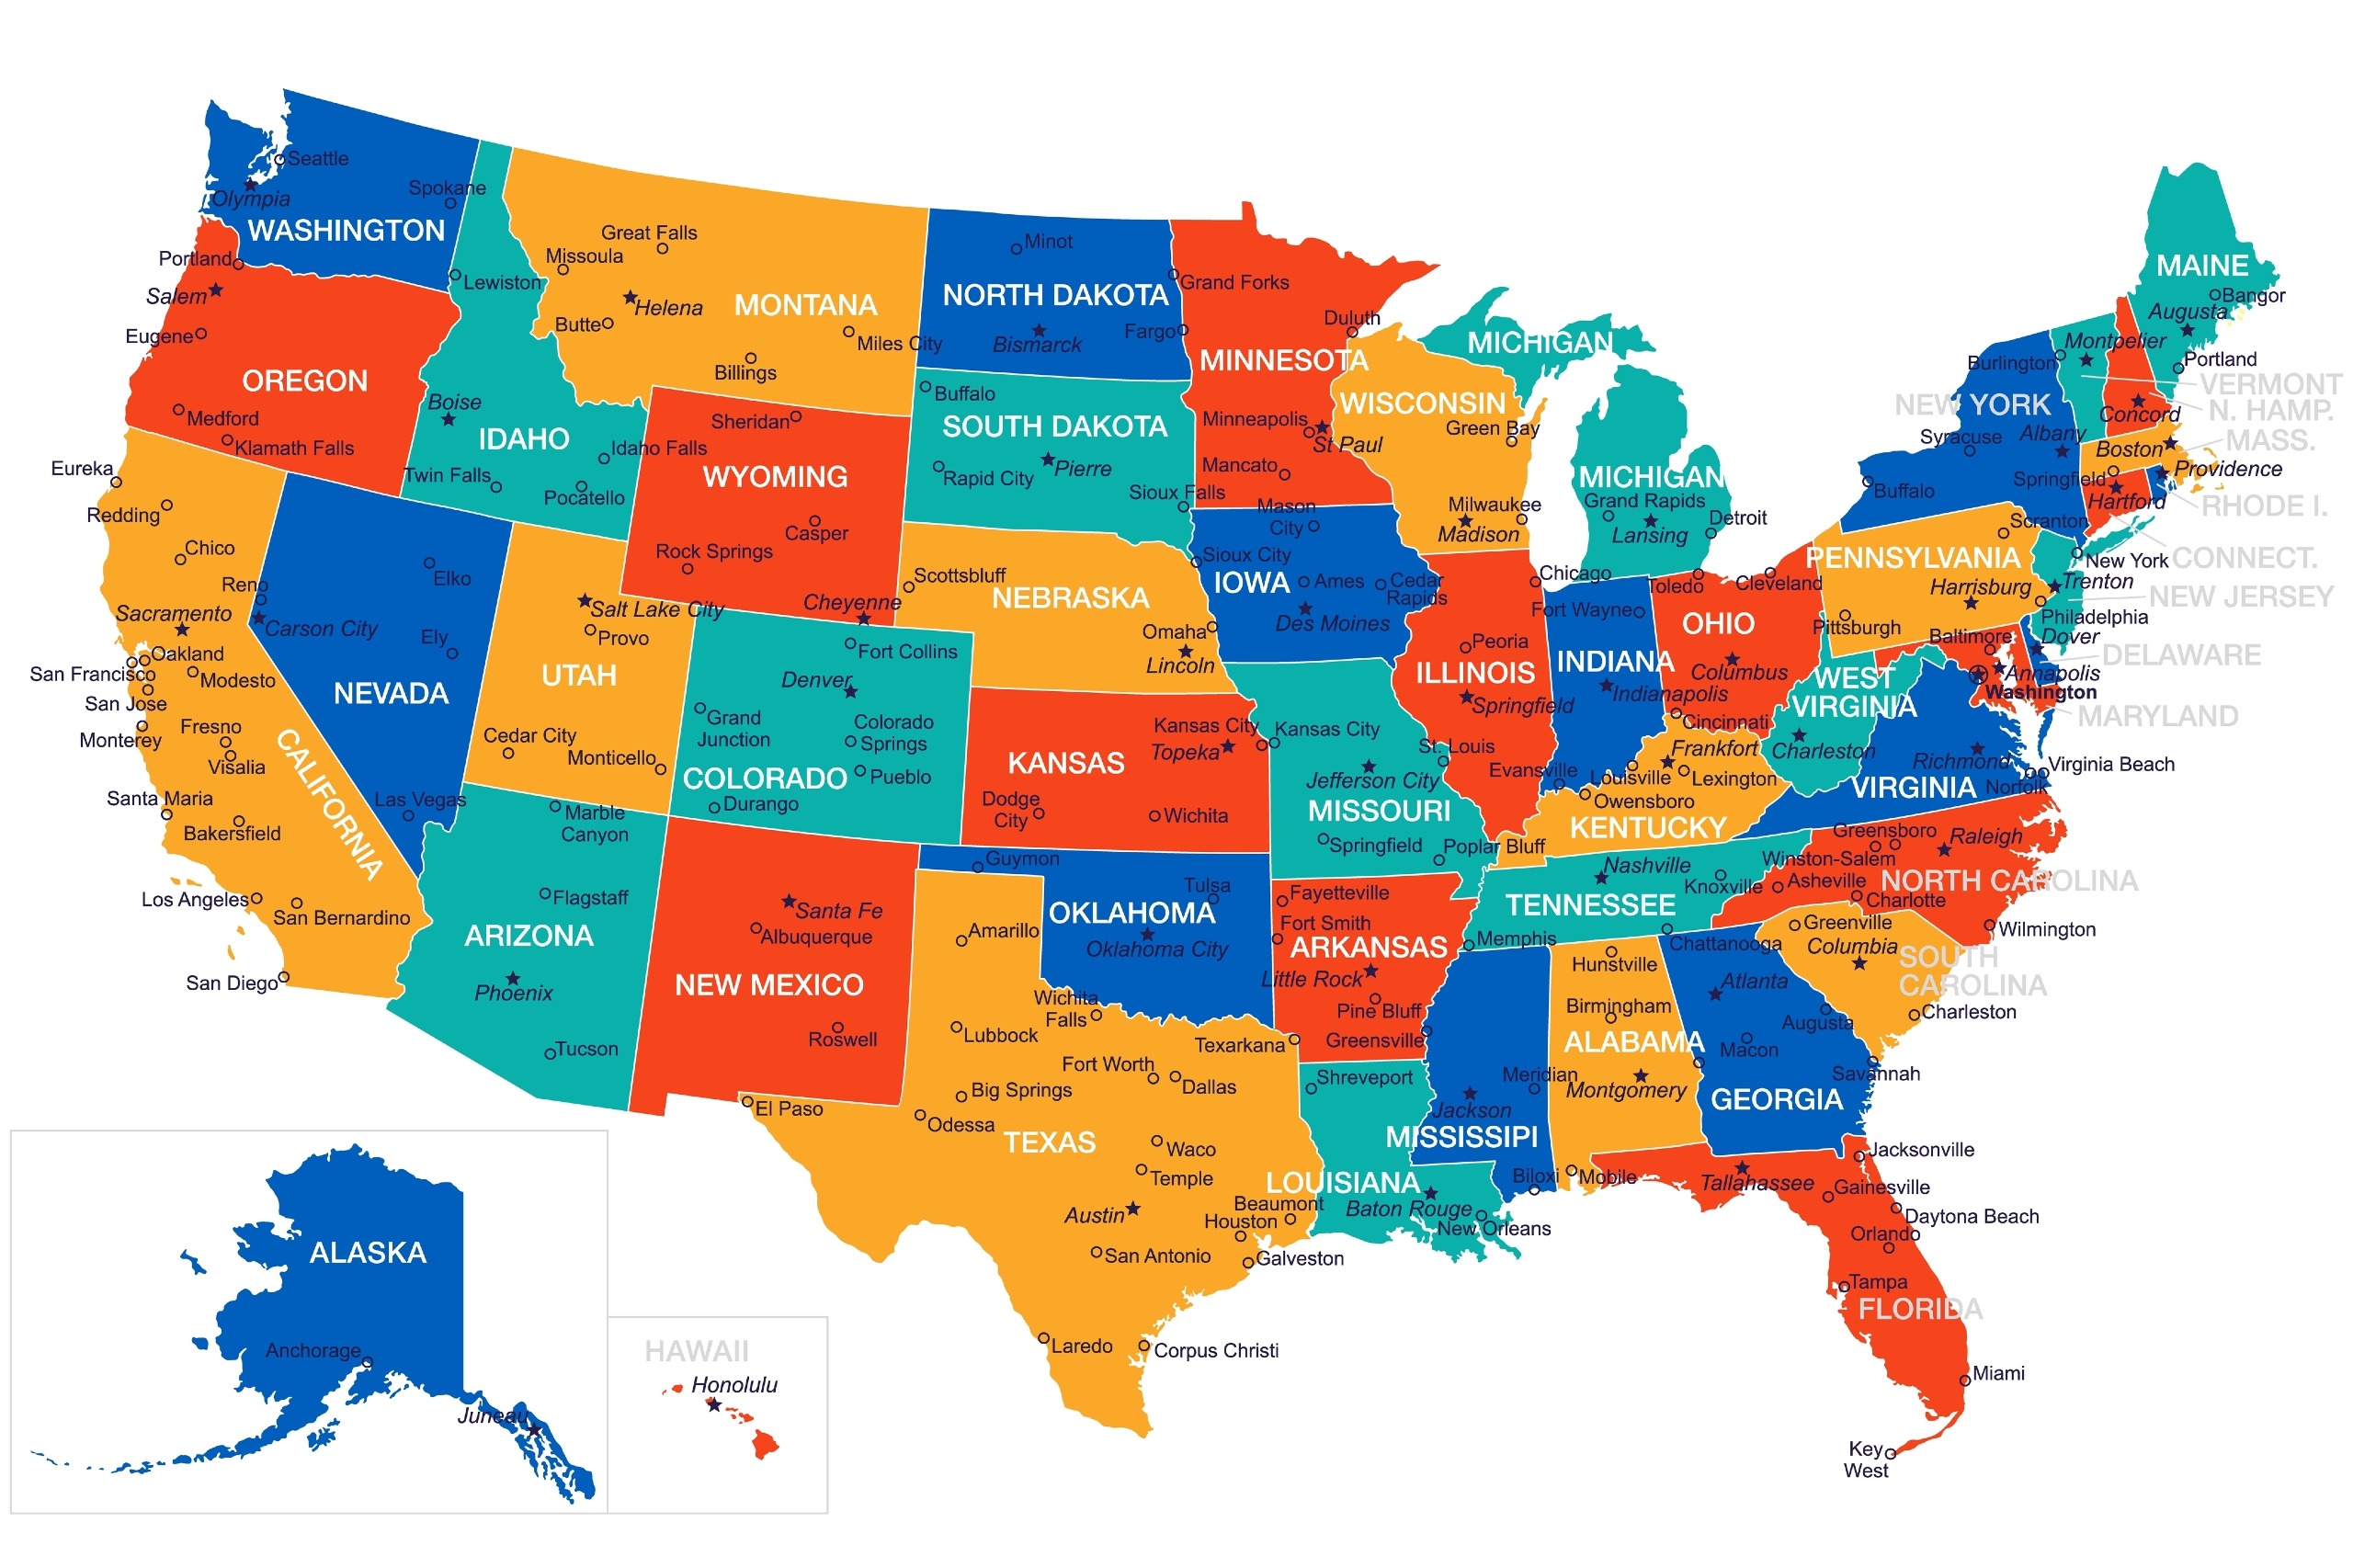
Usa Map With Cities And Highways
Detailed Map Of Usa – 50 States Of America Map – ICDK
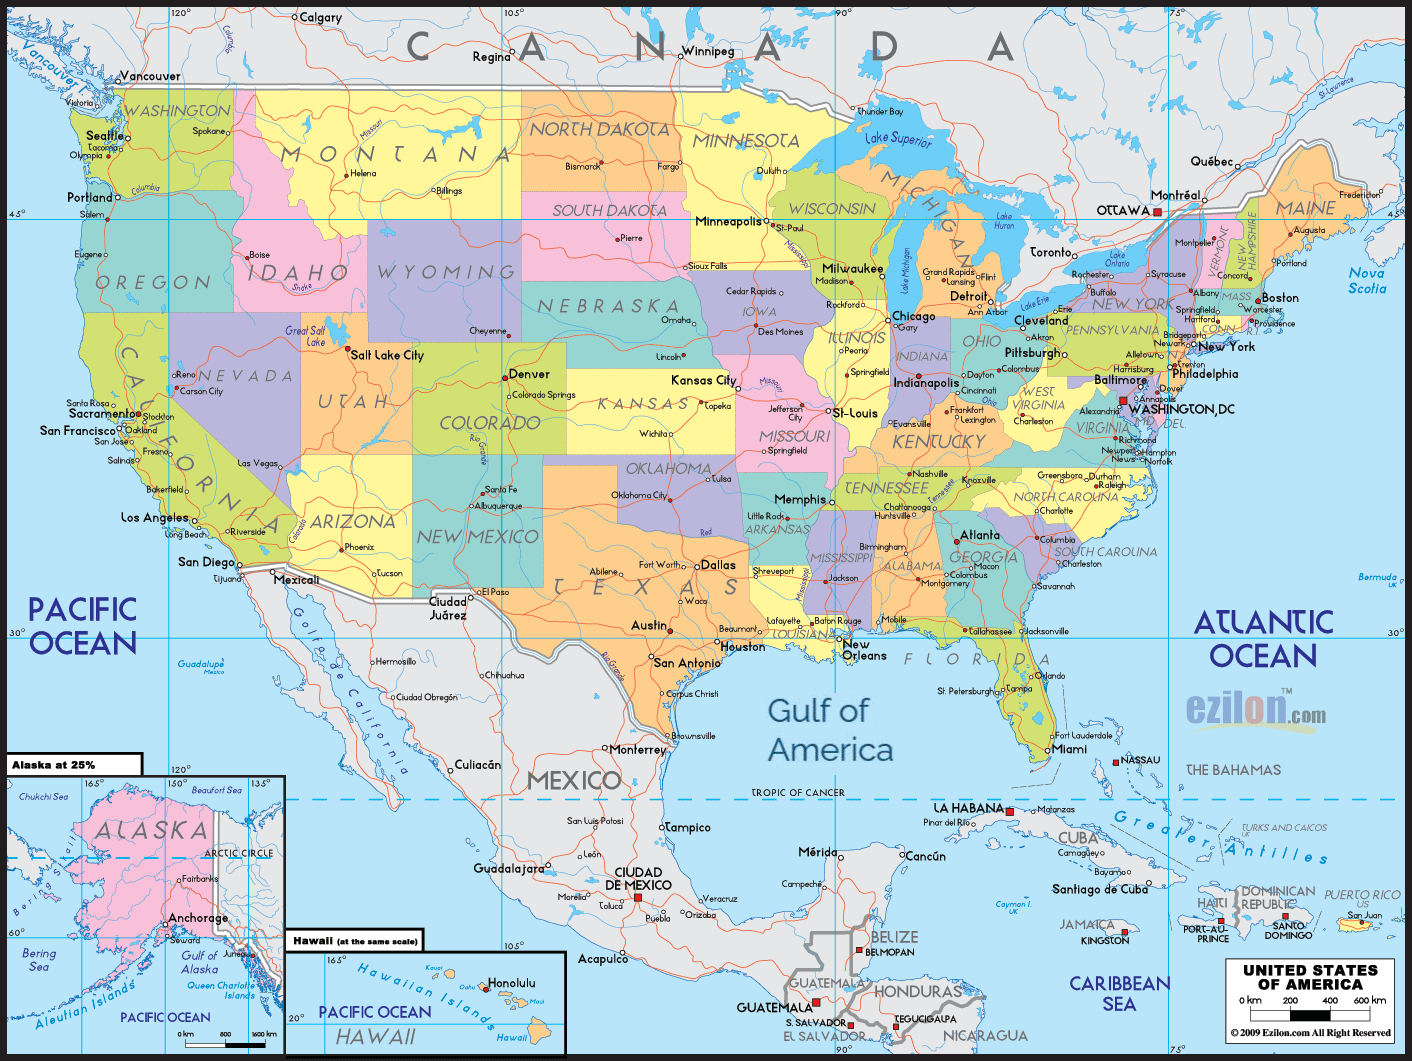
Detailed map of usa – 50 states of america map – ICDK
US Map Wallpapers - Wallpaper Cave
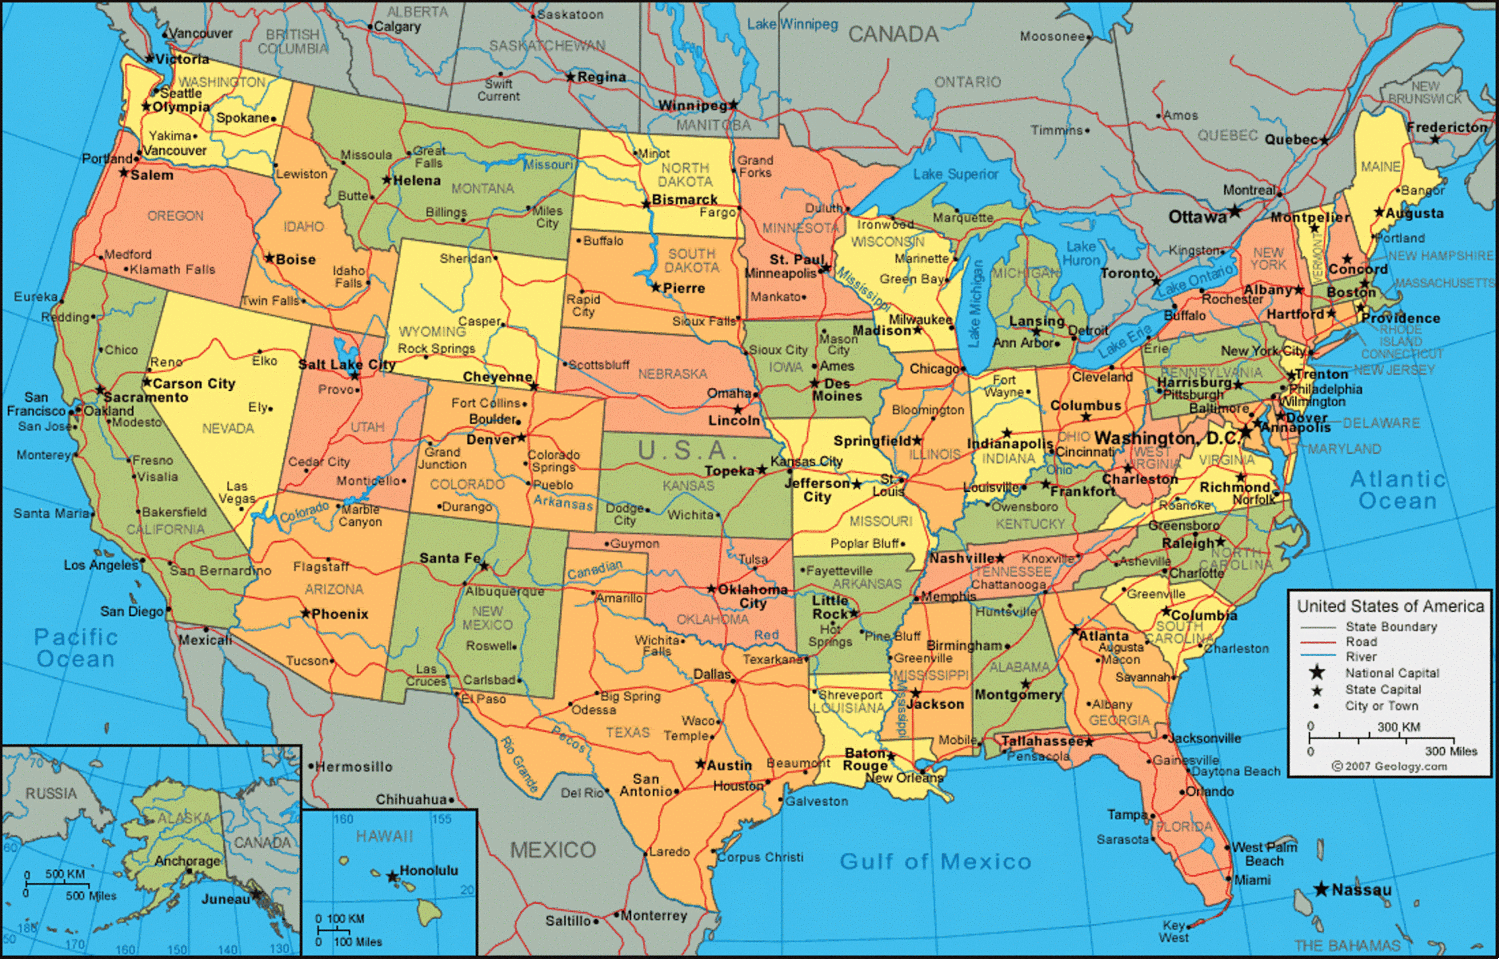
US Map Wallpapers - Wallpaper Cave
Large Map Of United States Printable - Printable Free Templates

Large Map Of United States Printable - Printable Free Templates
USA States Map | List Of U.S. States | U.S. Map
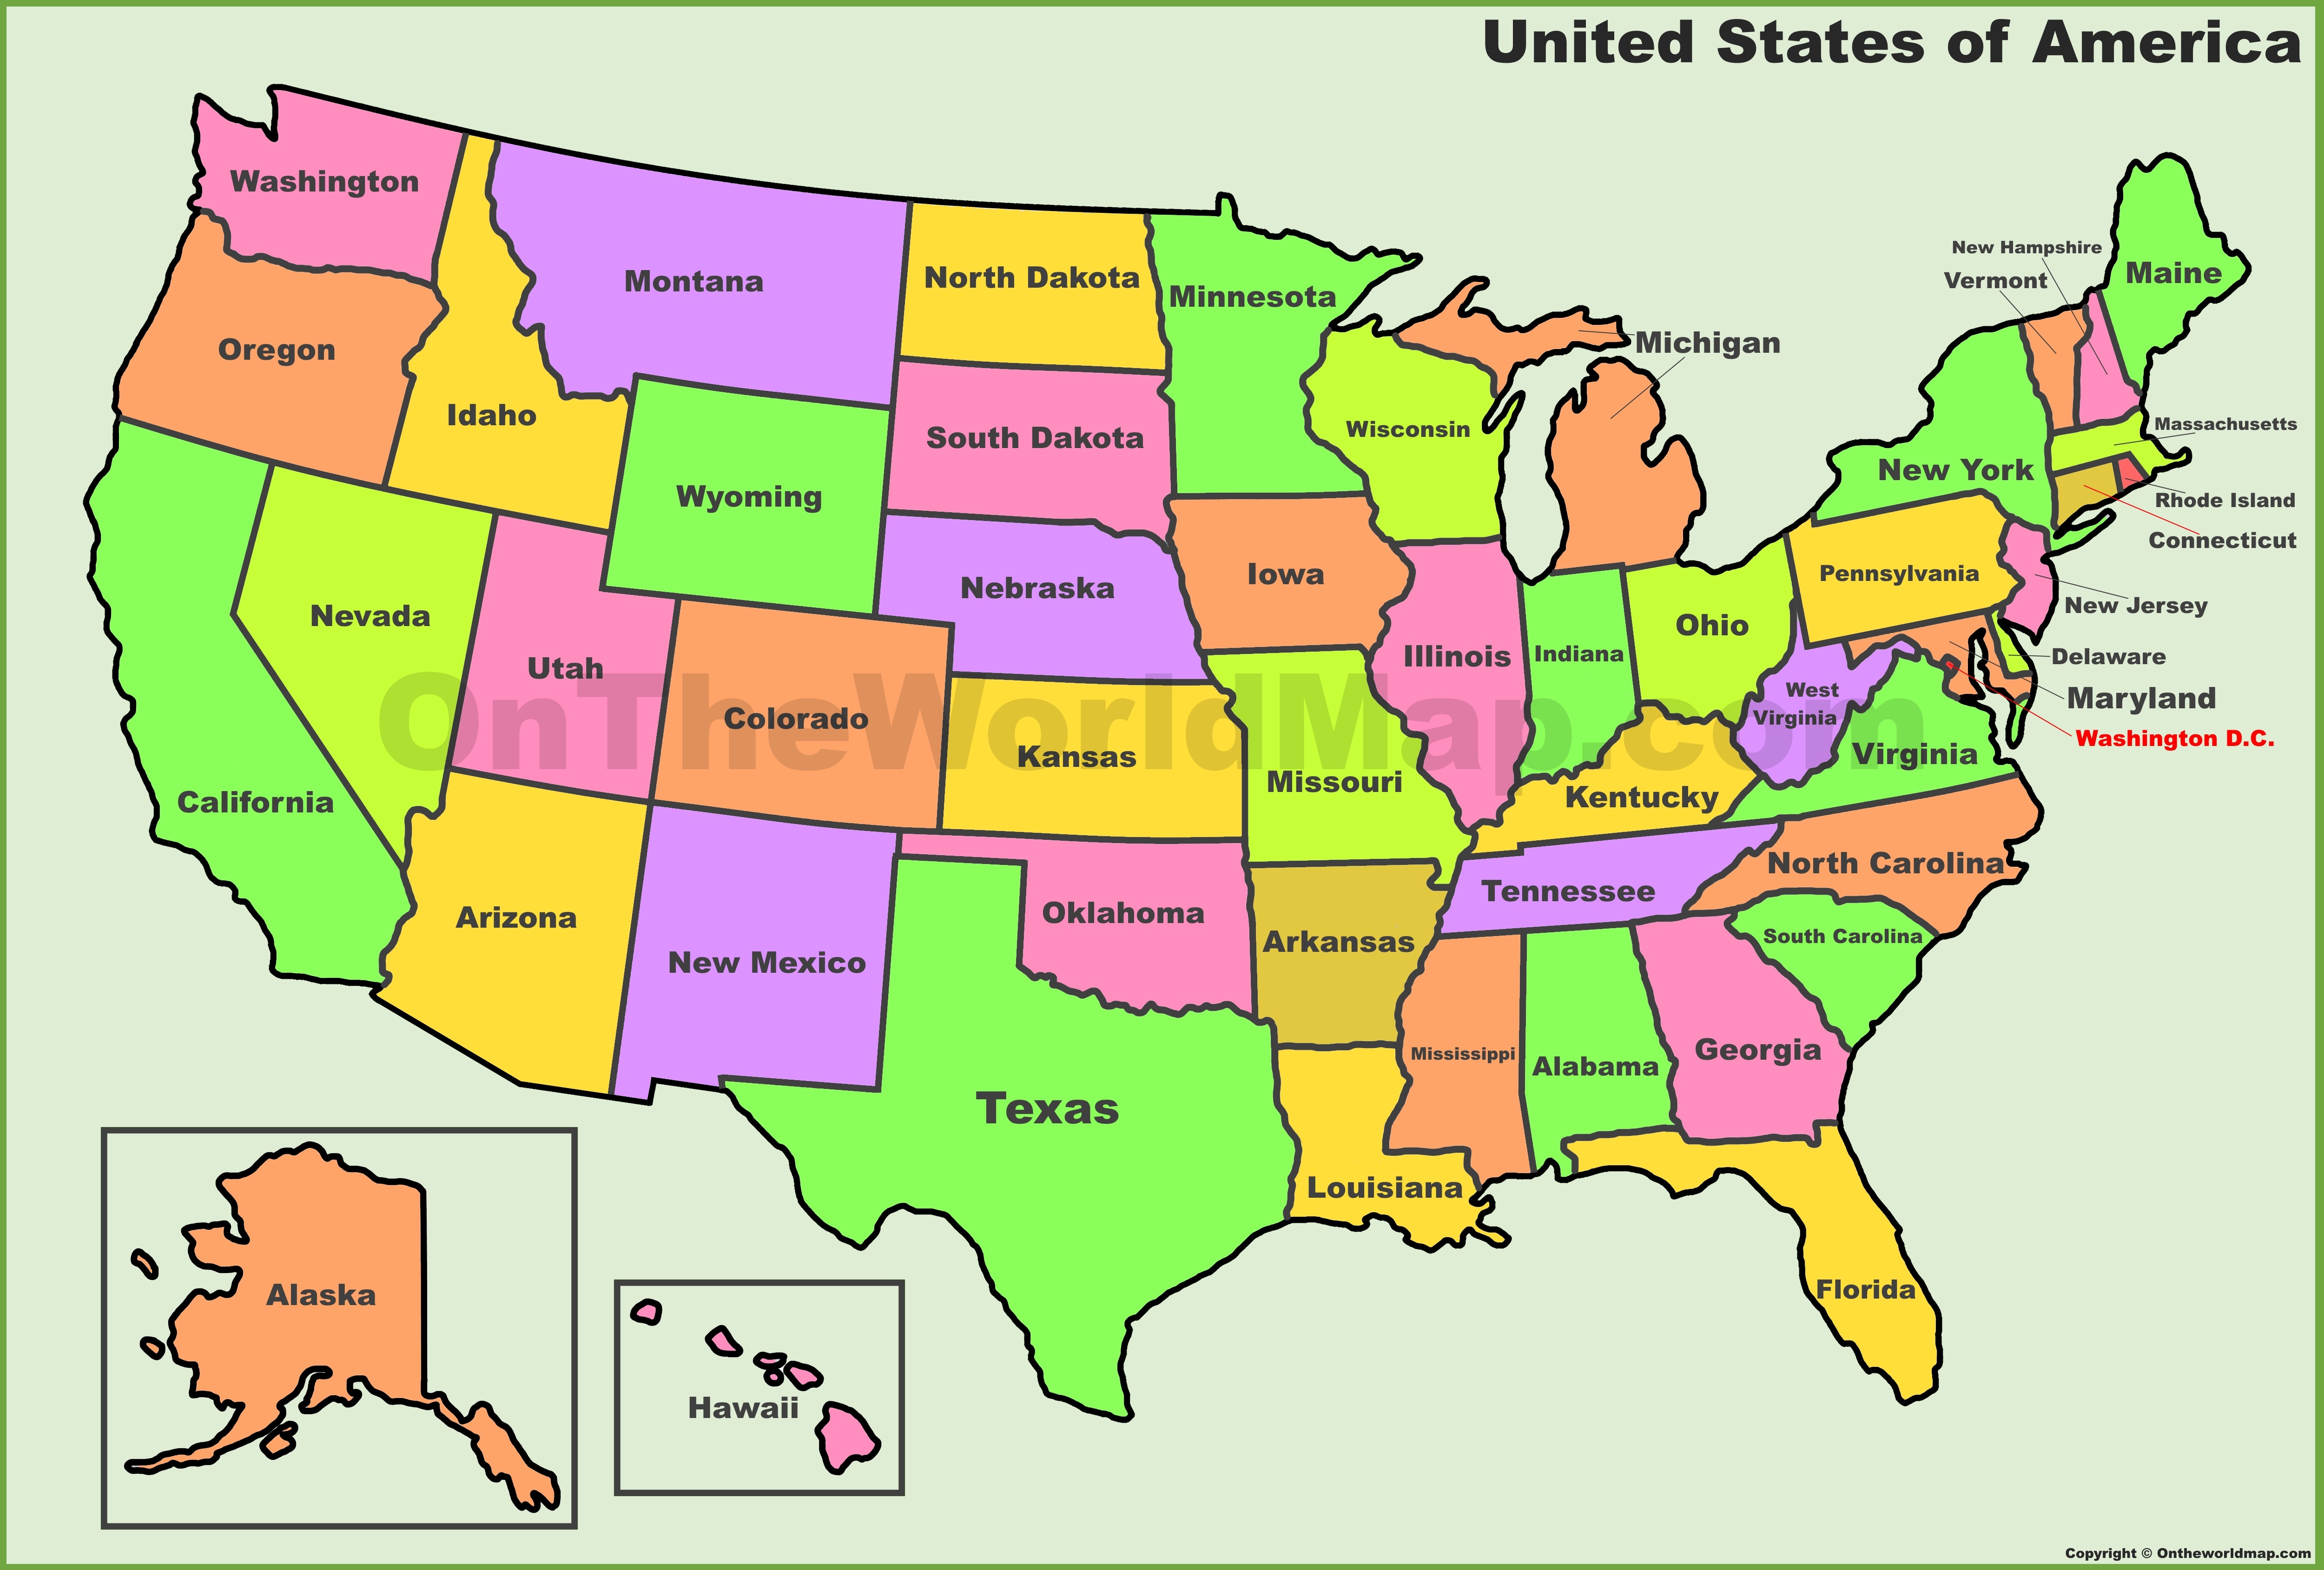
USA States Map | List of U.S. States | U.S. Map
United States Map With Names
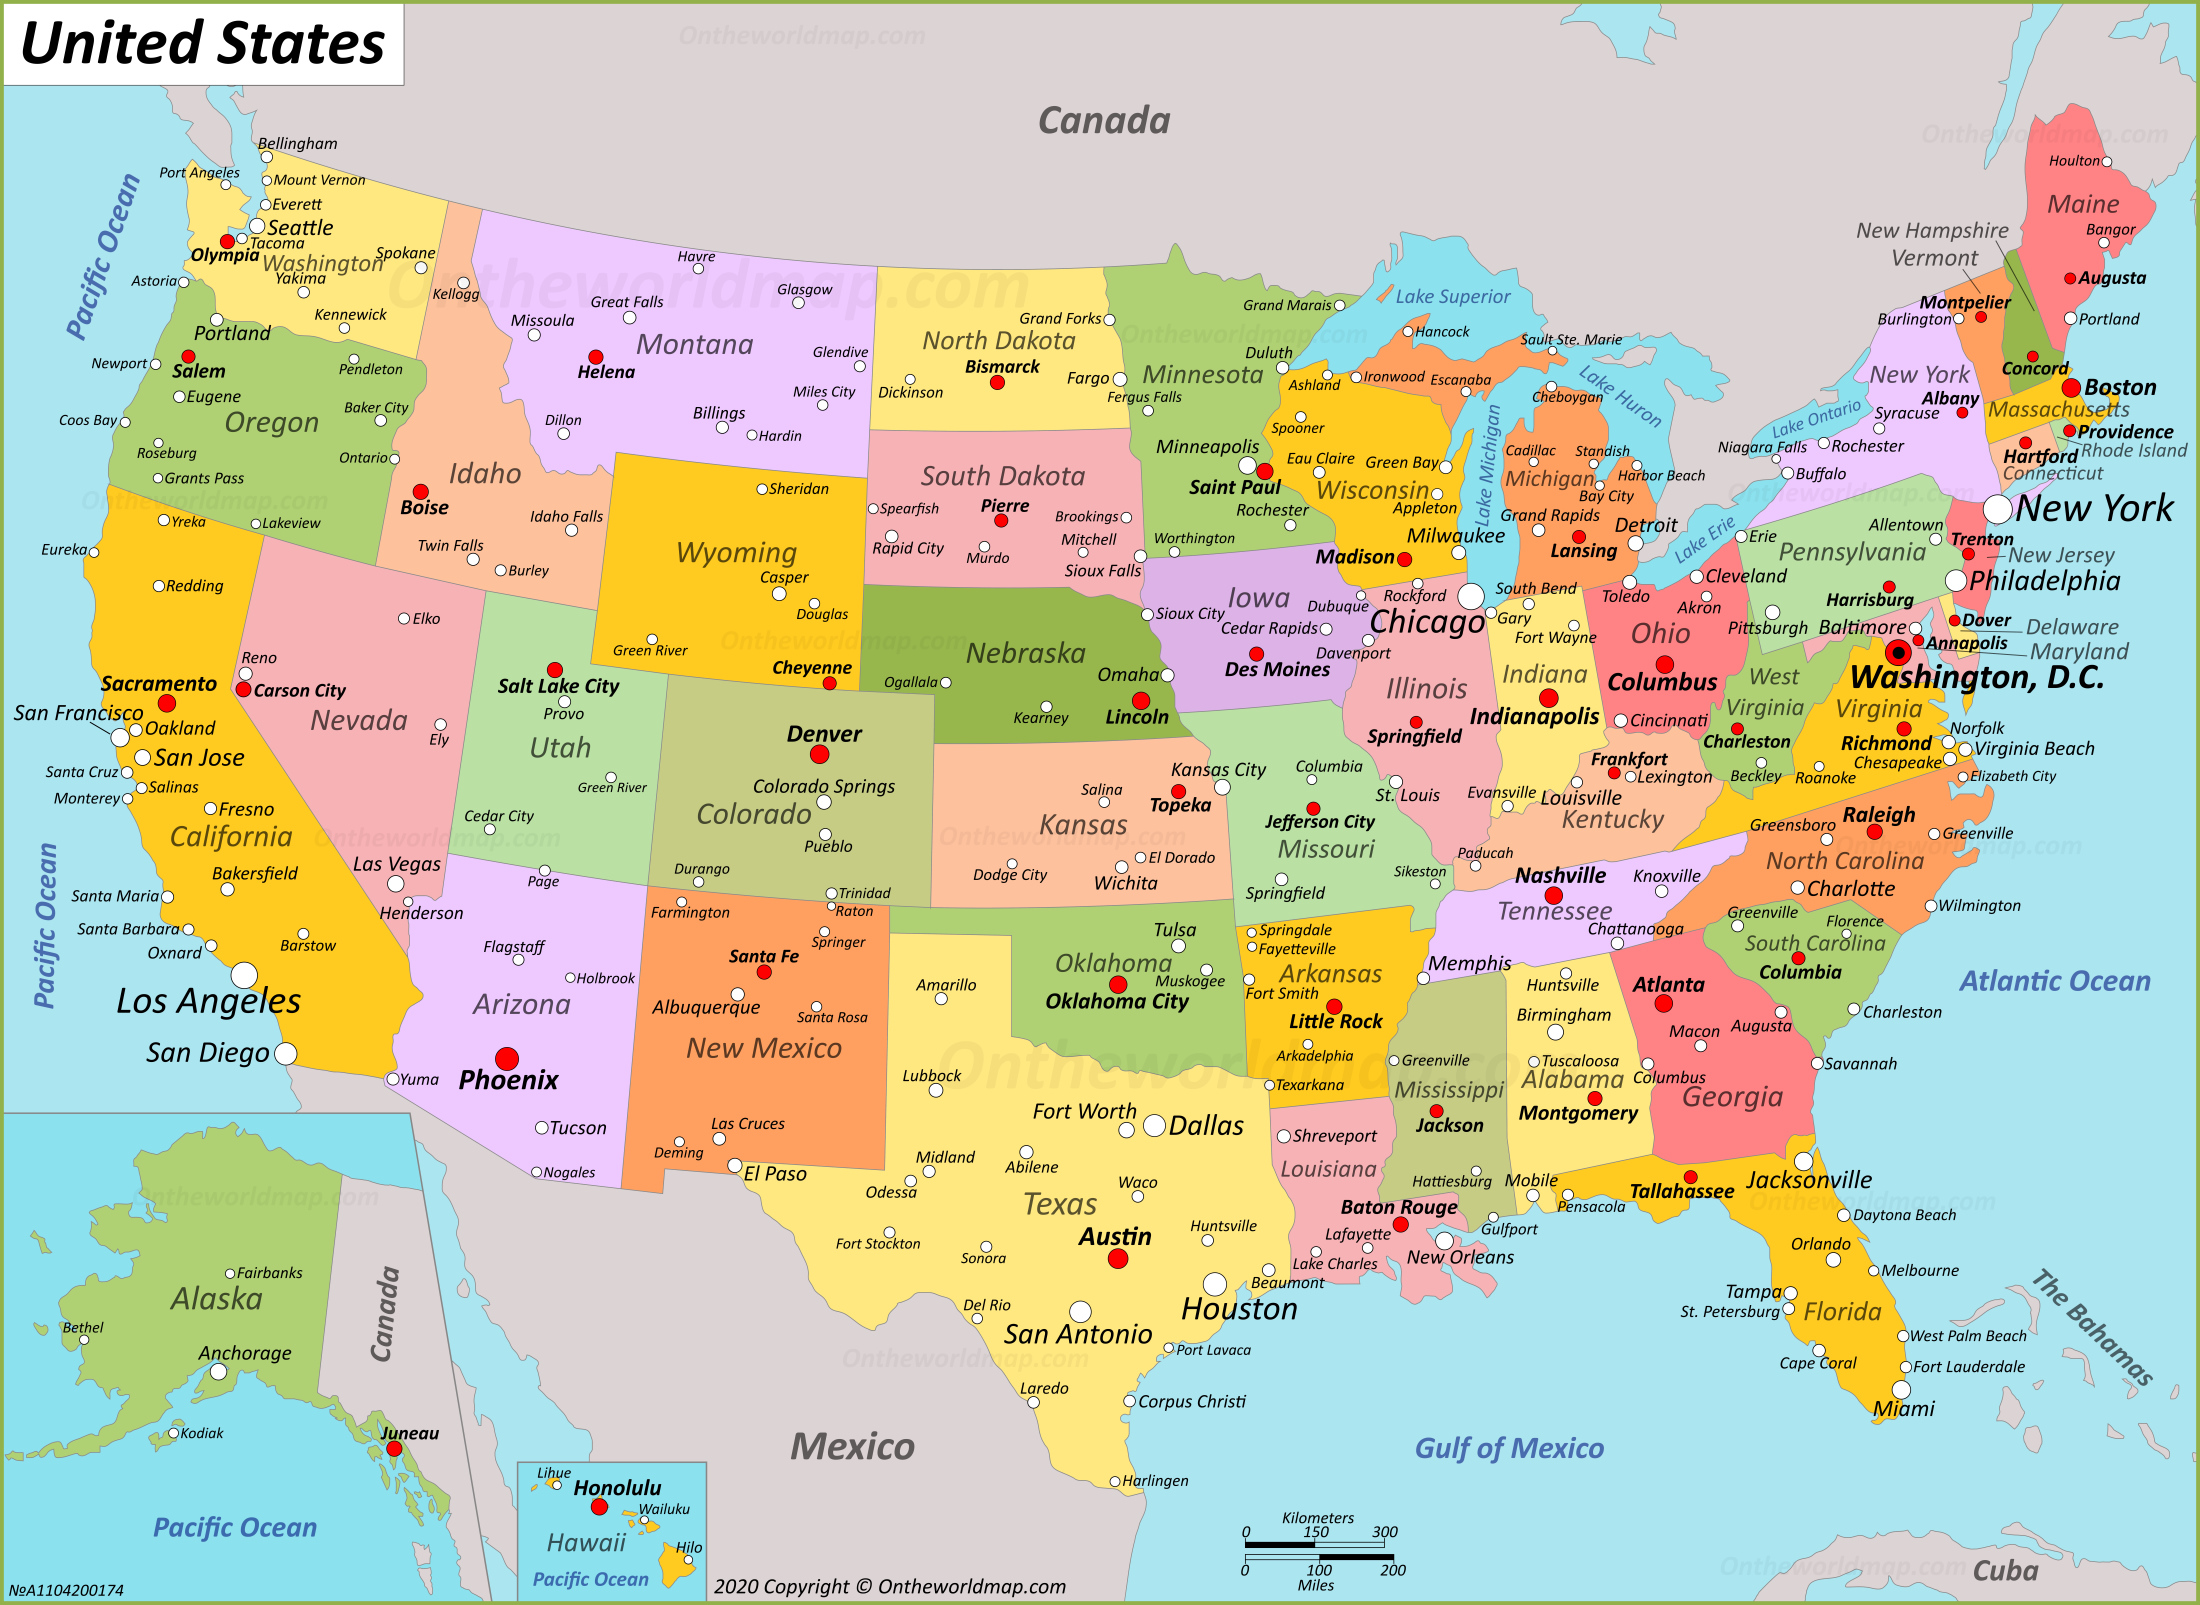
United States Map With Names
Explore The United States 🌄 🗽 Detailed Map With Cities And States
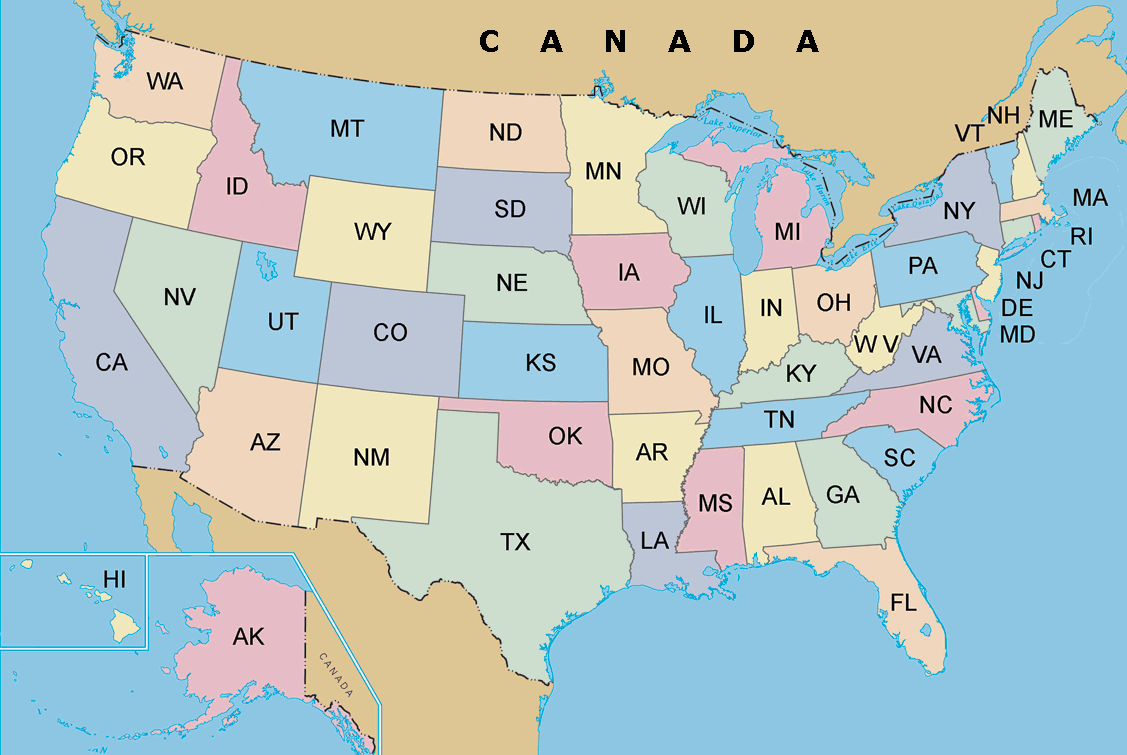
Explore the United States 🌄 🗽 Detailed Map with Cities and States
Map Of United States
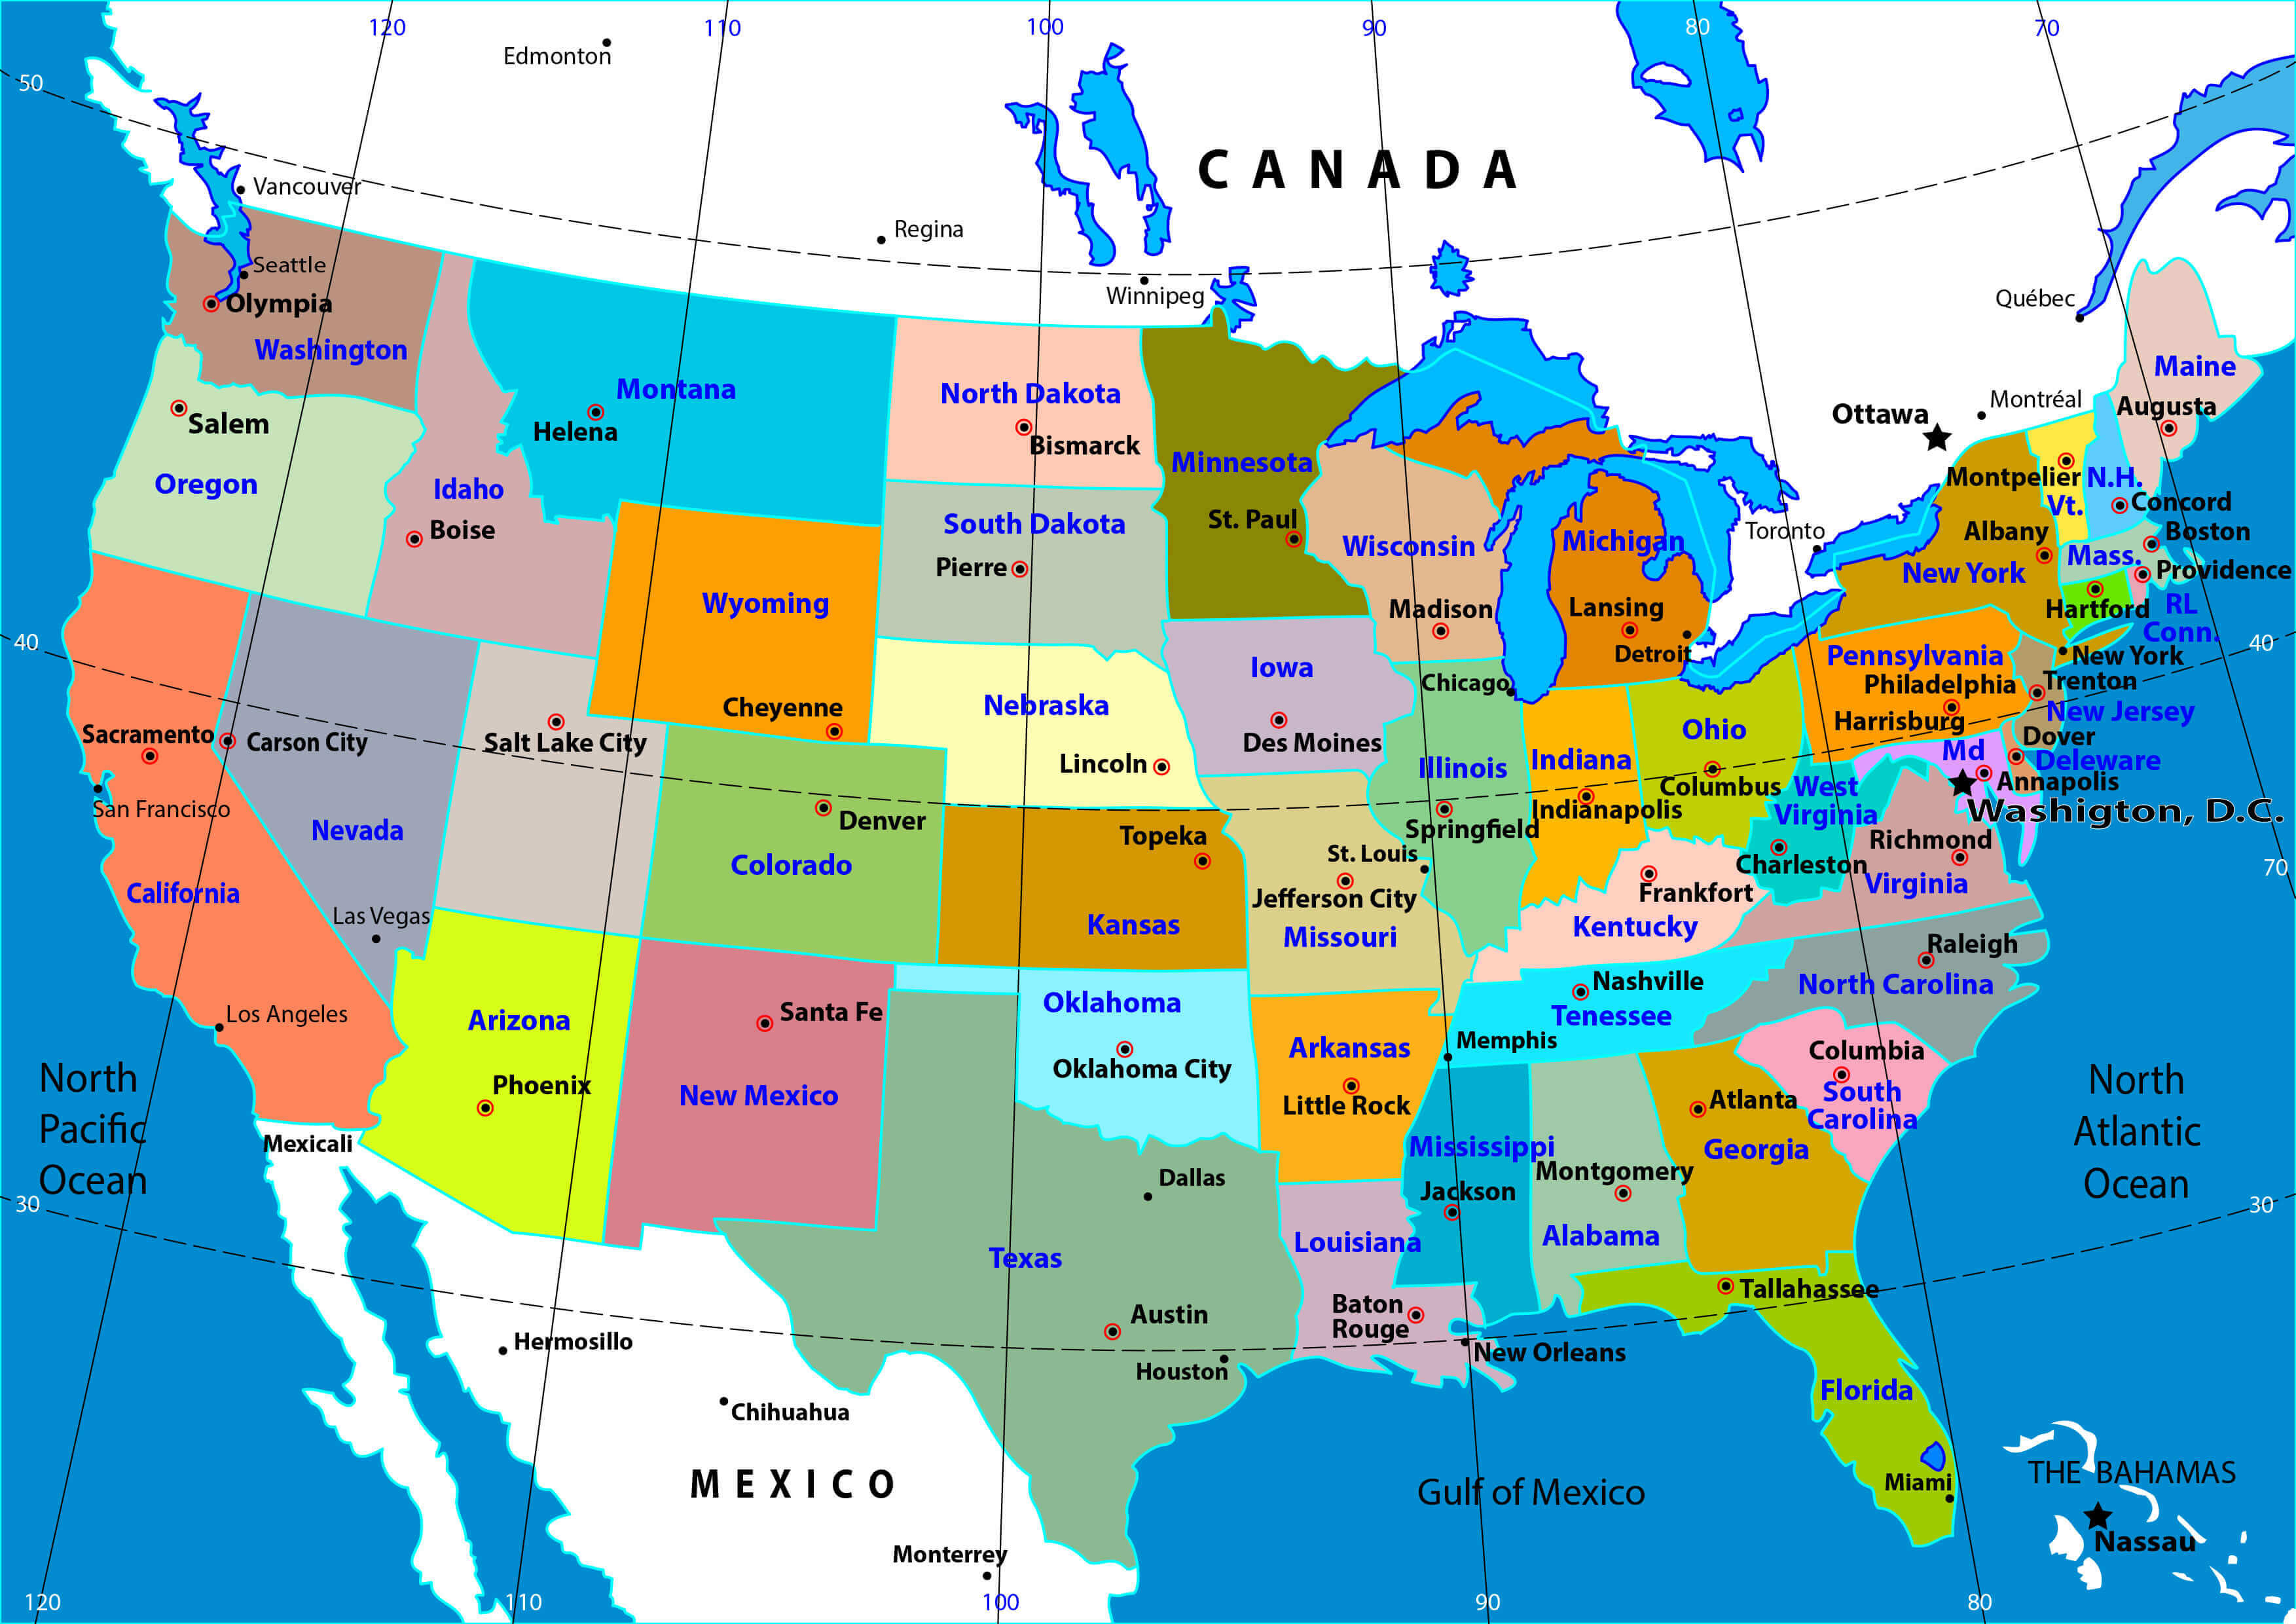
Map of United States
Map Of United States Of America With States Name 21659145 Vector Art At
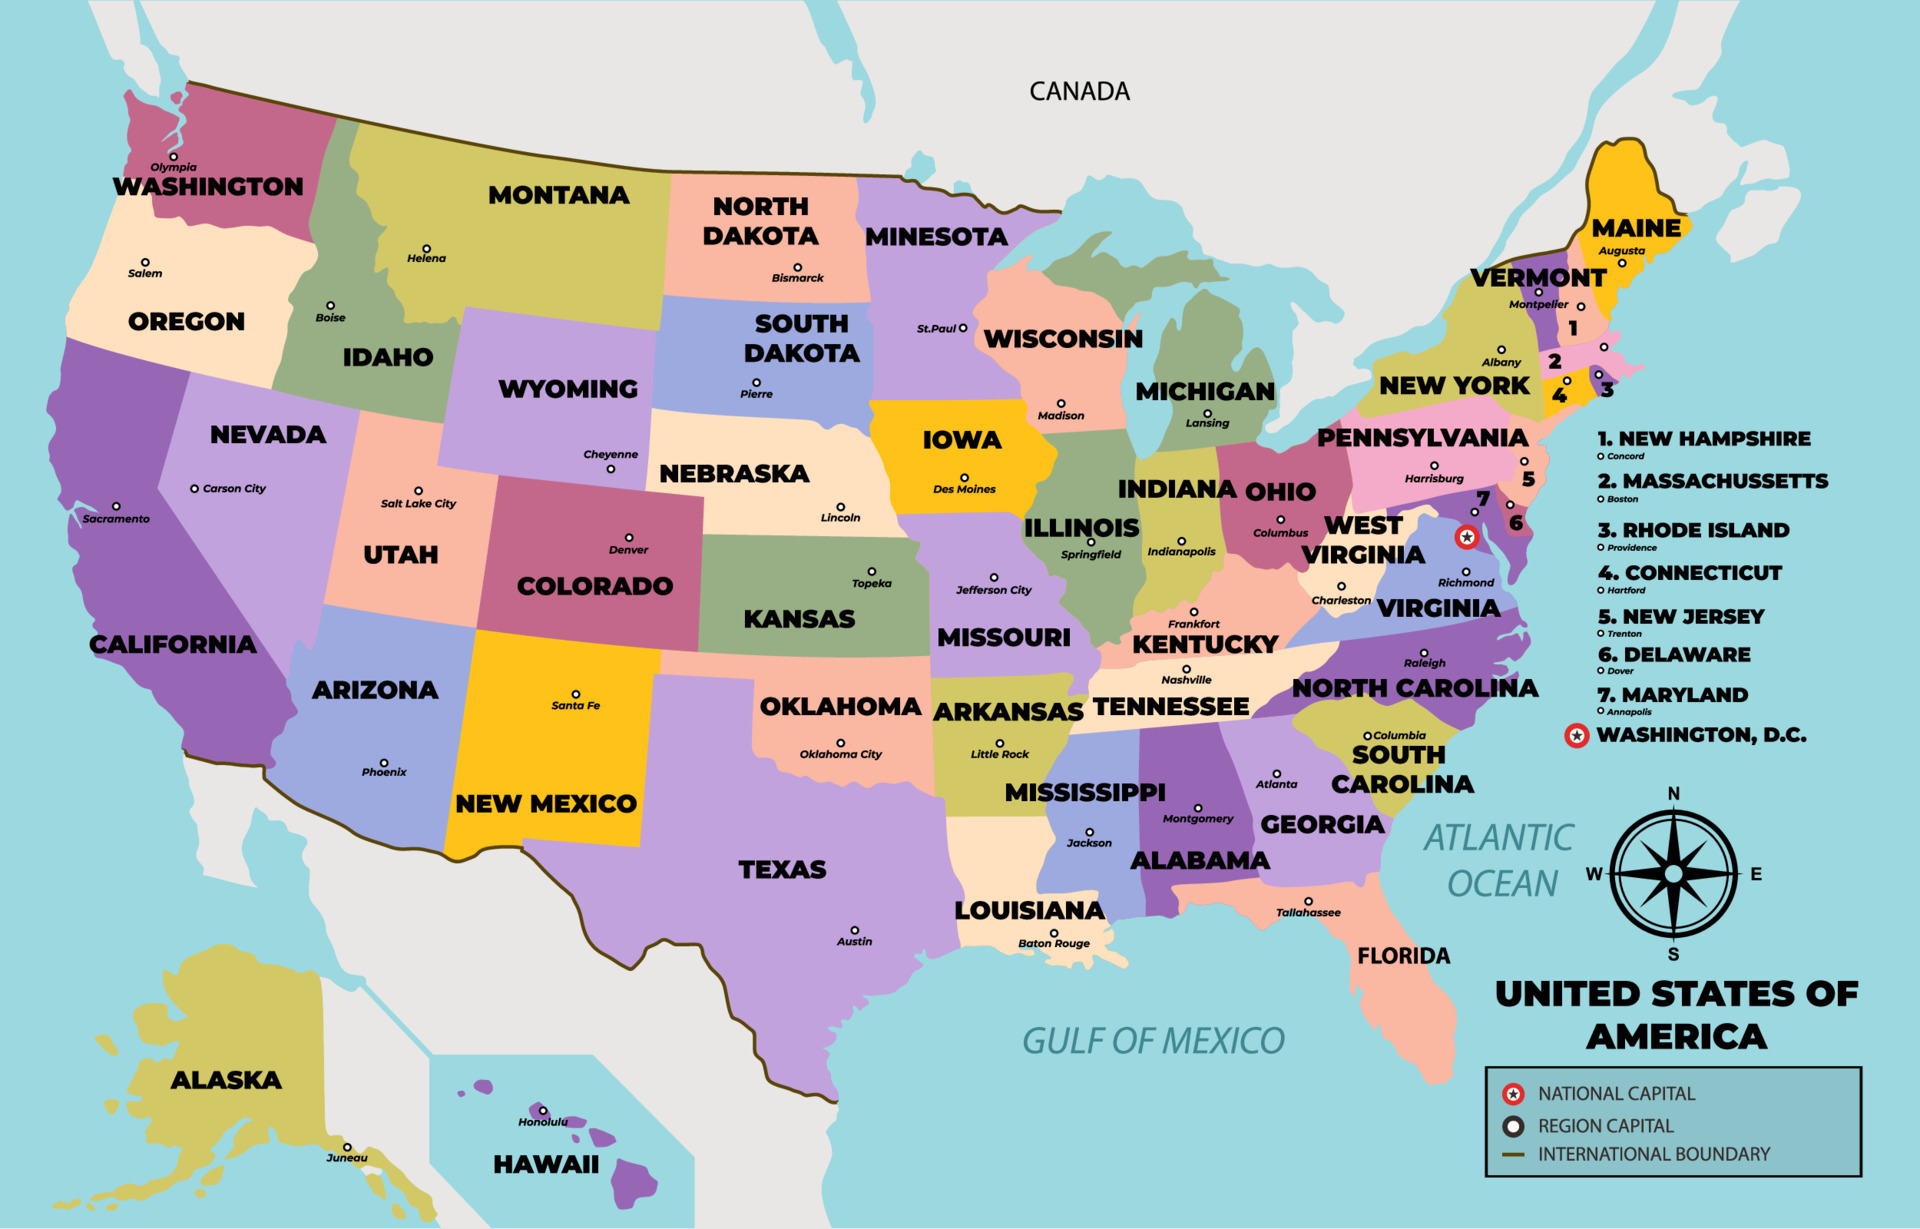
Map Of United States Of America With States Name 21659145 Vector Art at ...
Political Map Of USA (Colored State Map) | Mappr
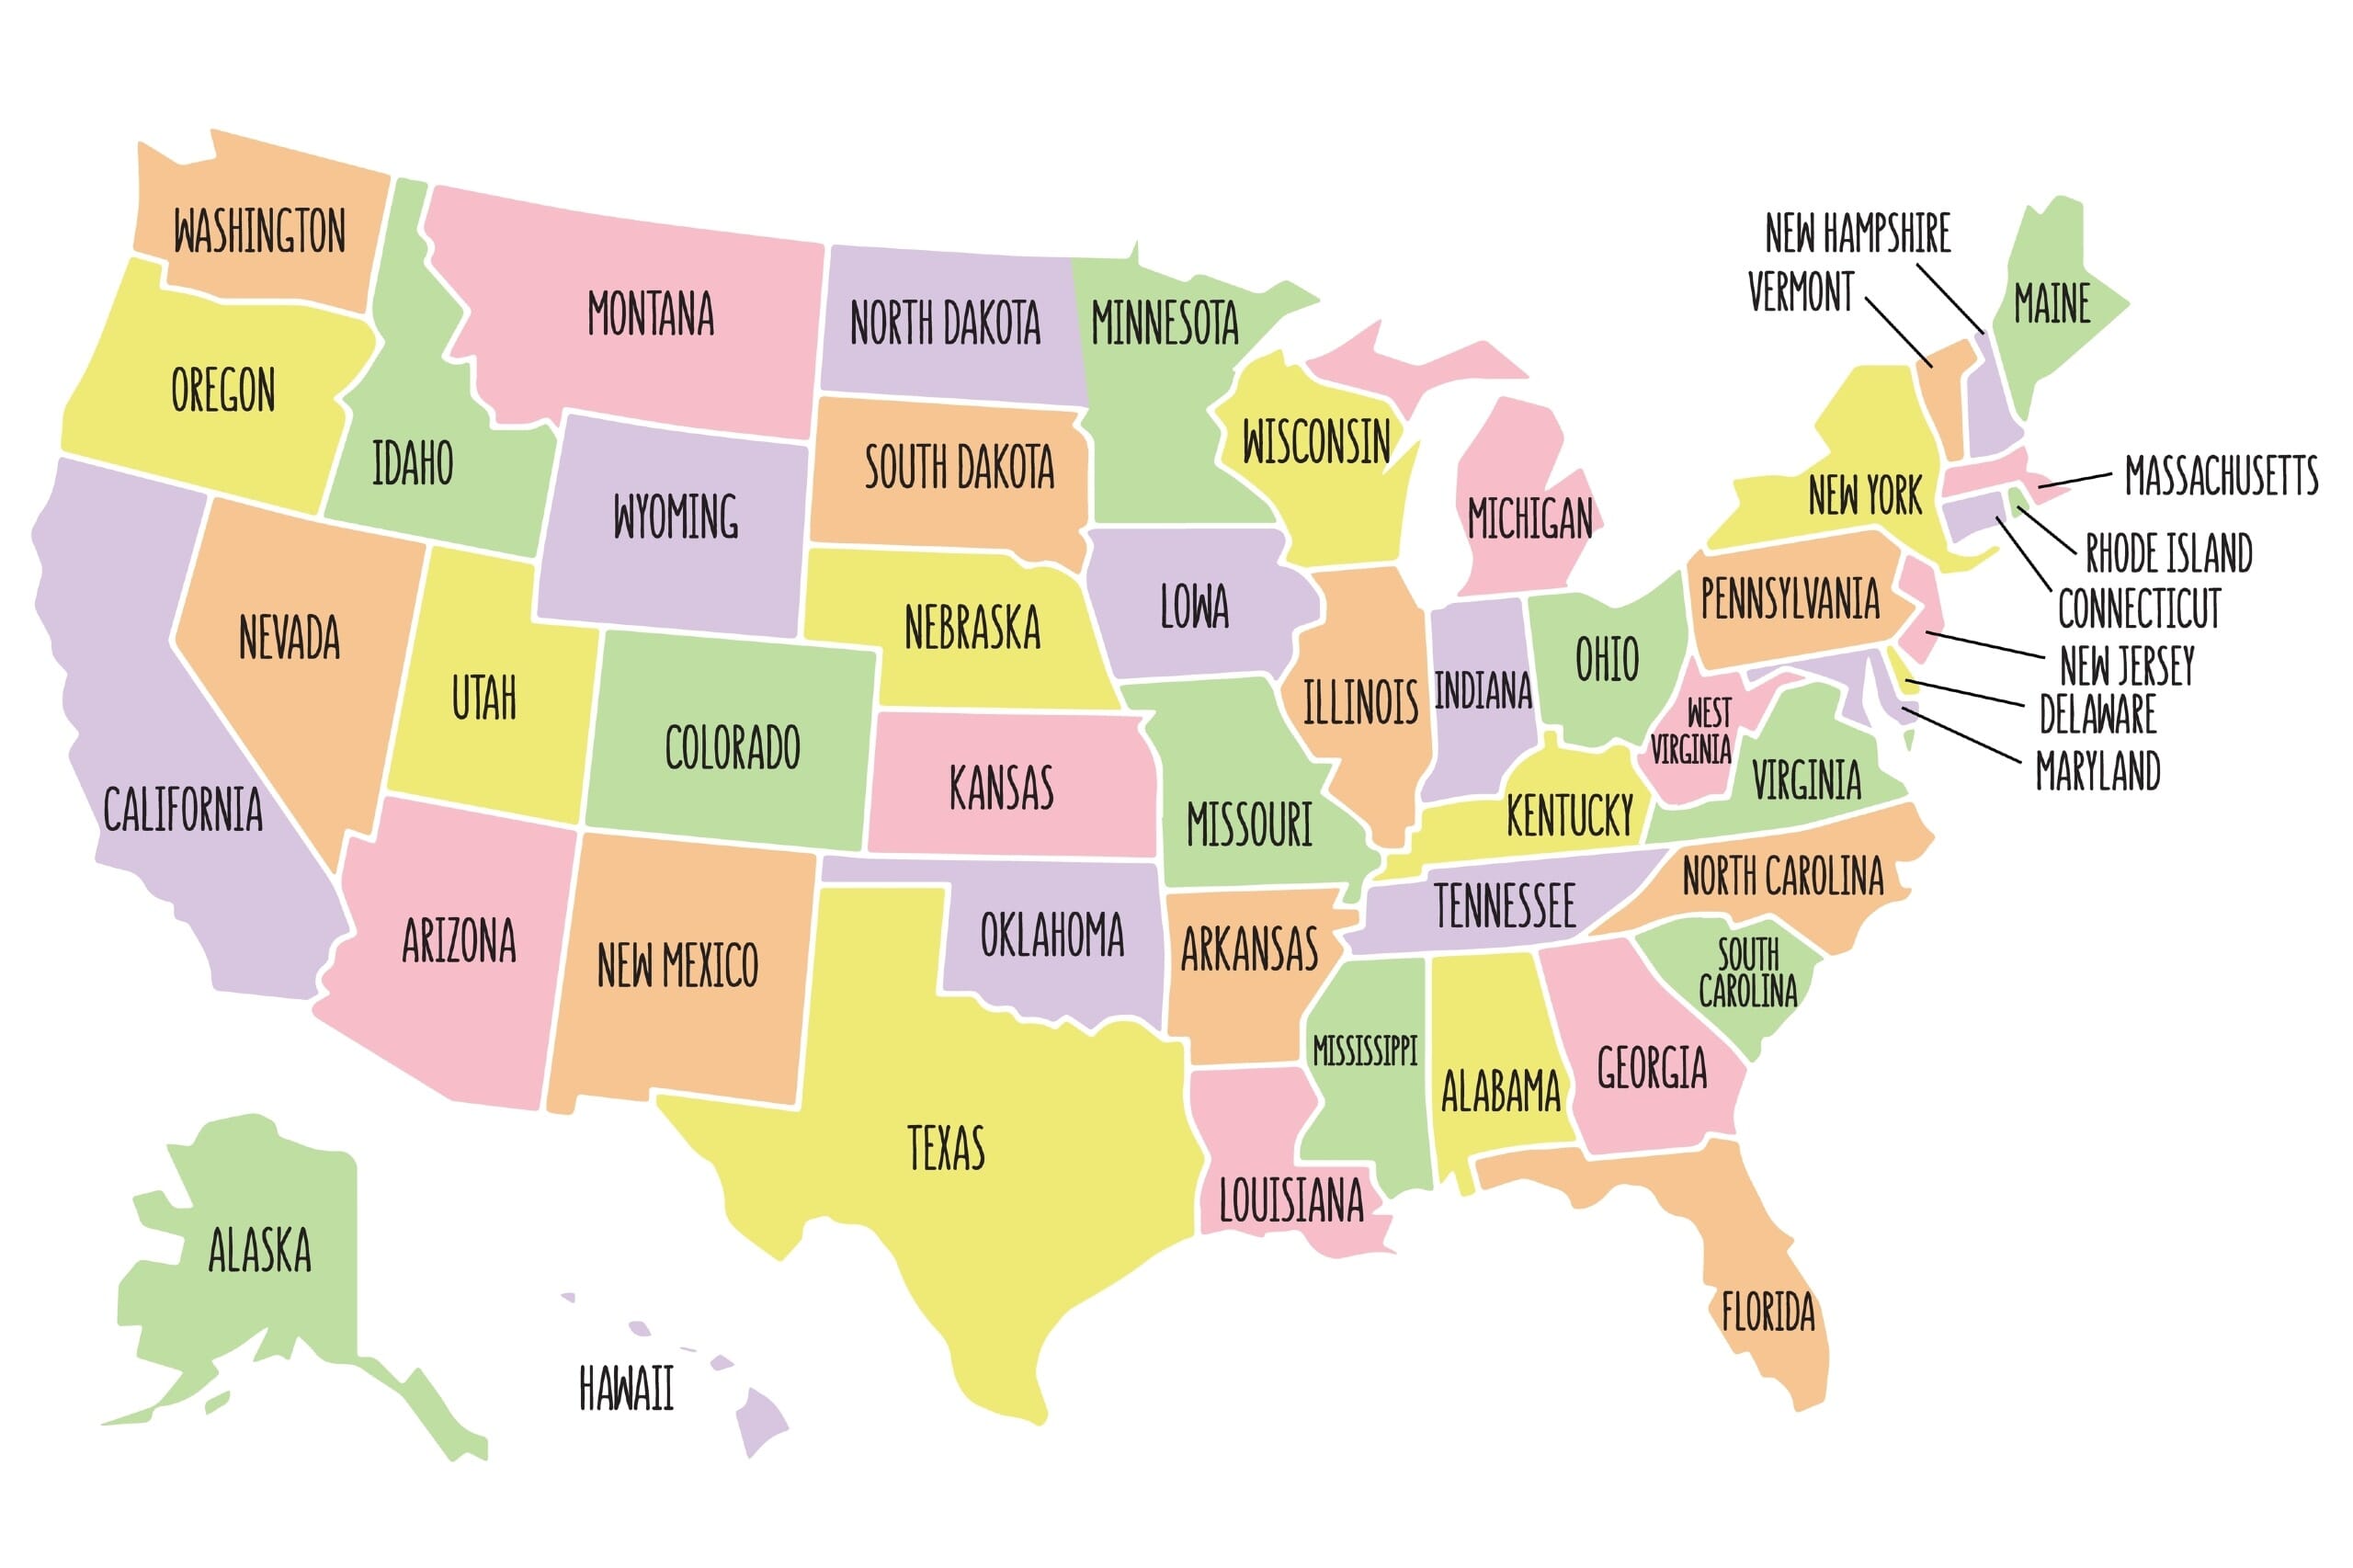
Political Map of USA (Colored State Map) | Mappr
Map Of The United States. Detailed Map Of The USA With State Borders

Map of the United States. Detailed map of the USA with state borders ...
Map Of United States - MAPS
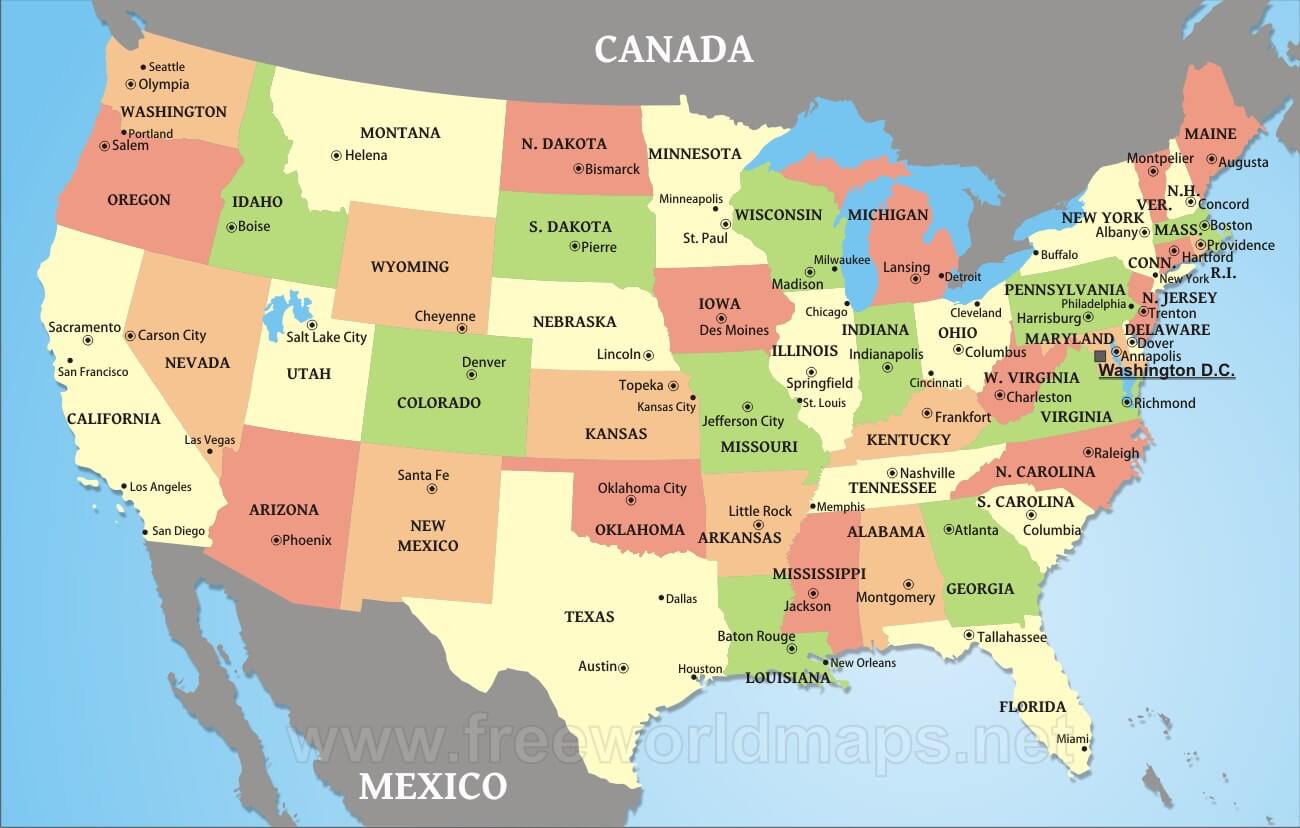
map of united states - MAPS
States And Capitals Chartunited States Political Map With Capitals
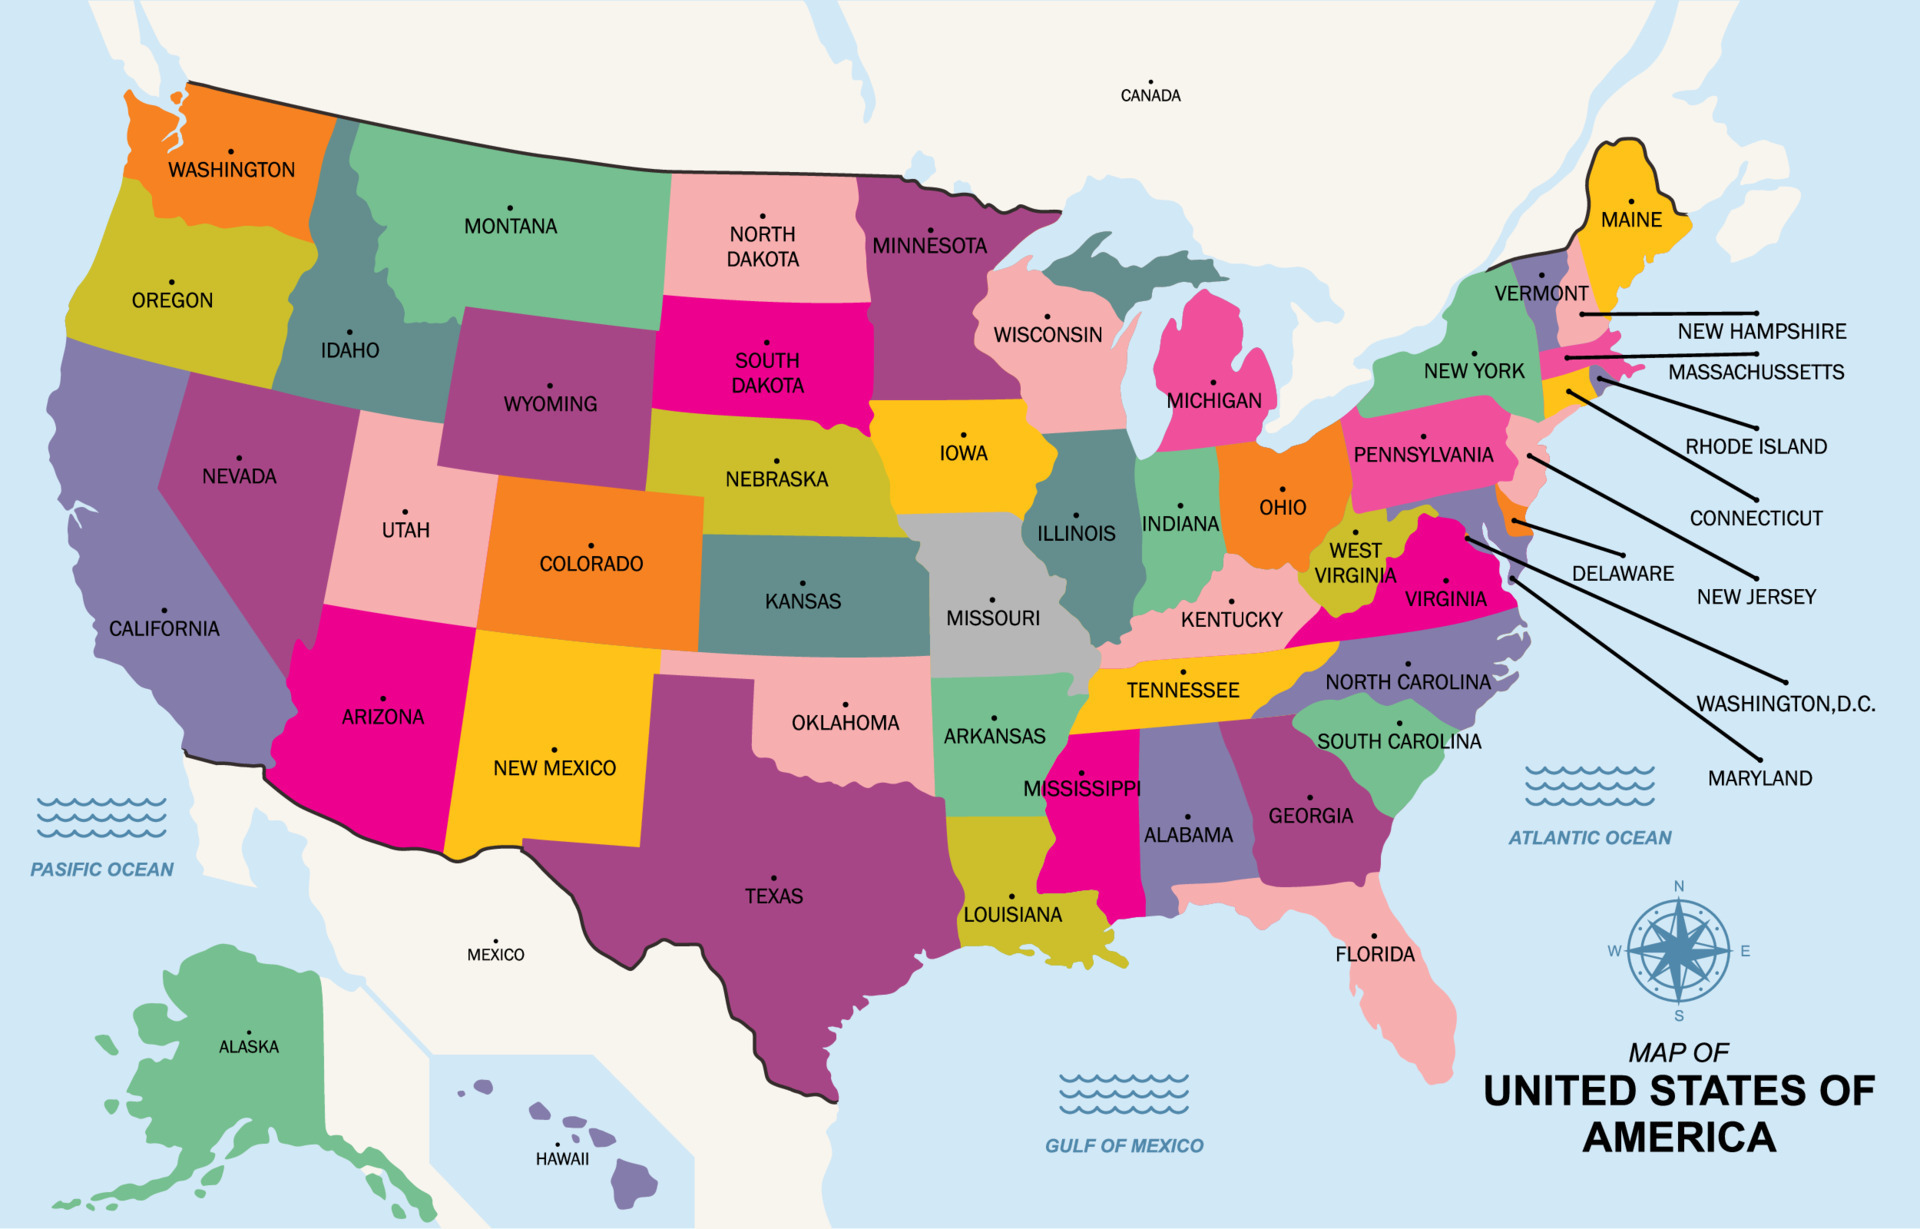
States And Capitals Chartunited States Political Map With Capitals
Large Size Physical Map Of The United States - Worldometer
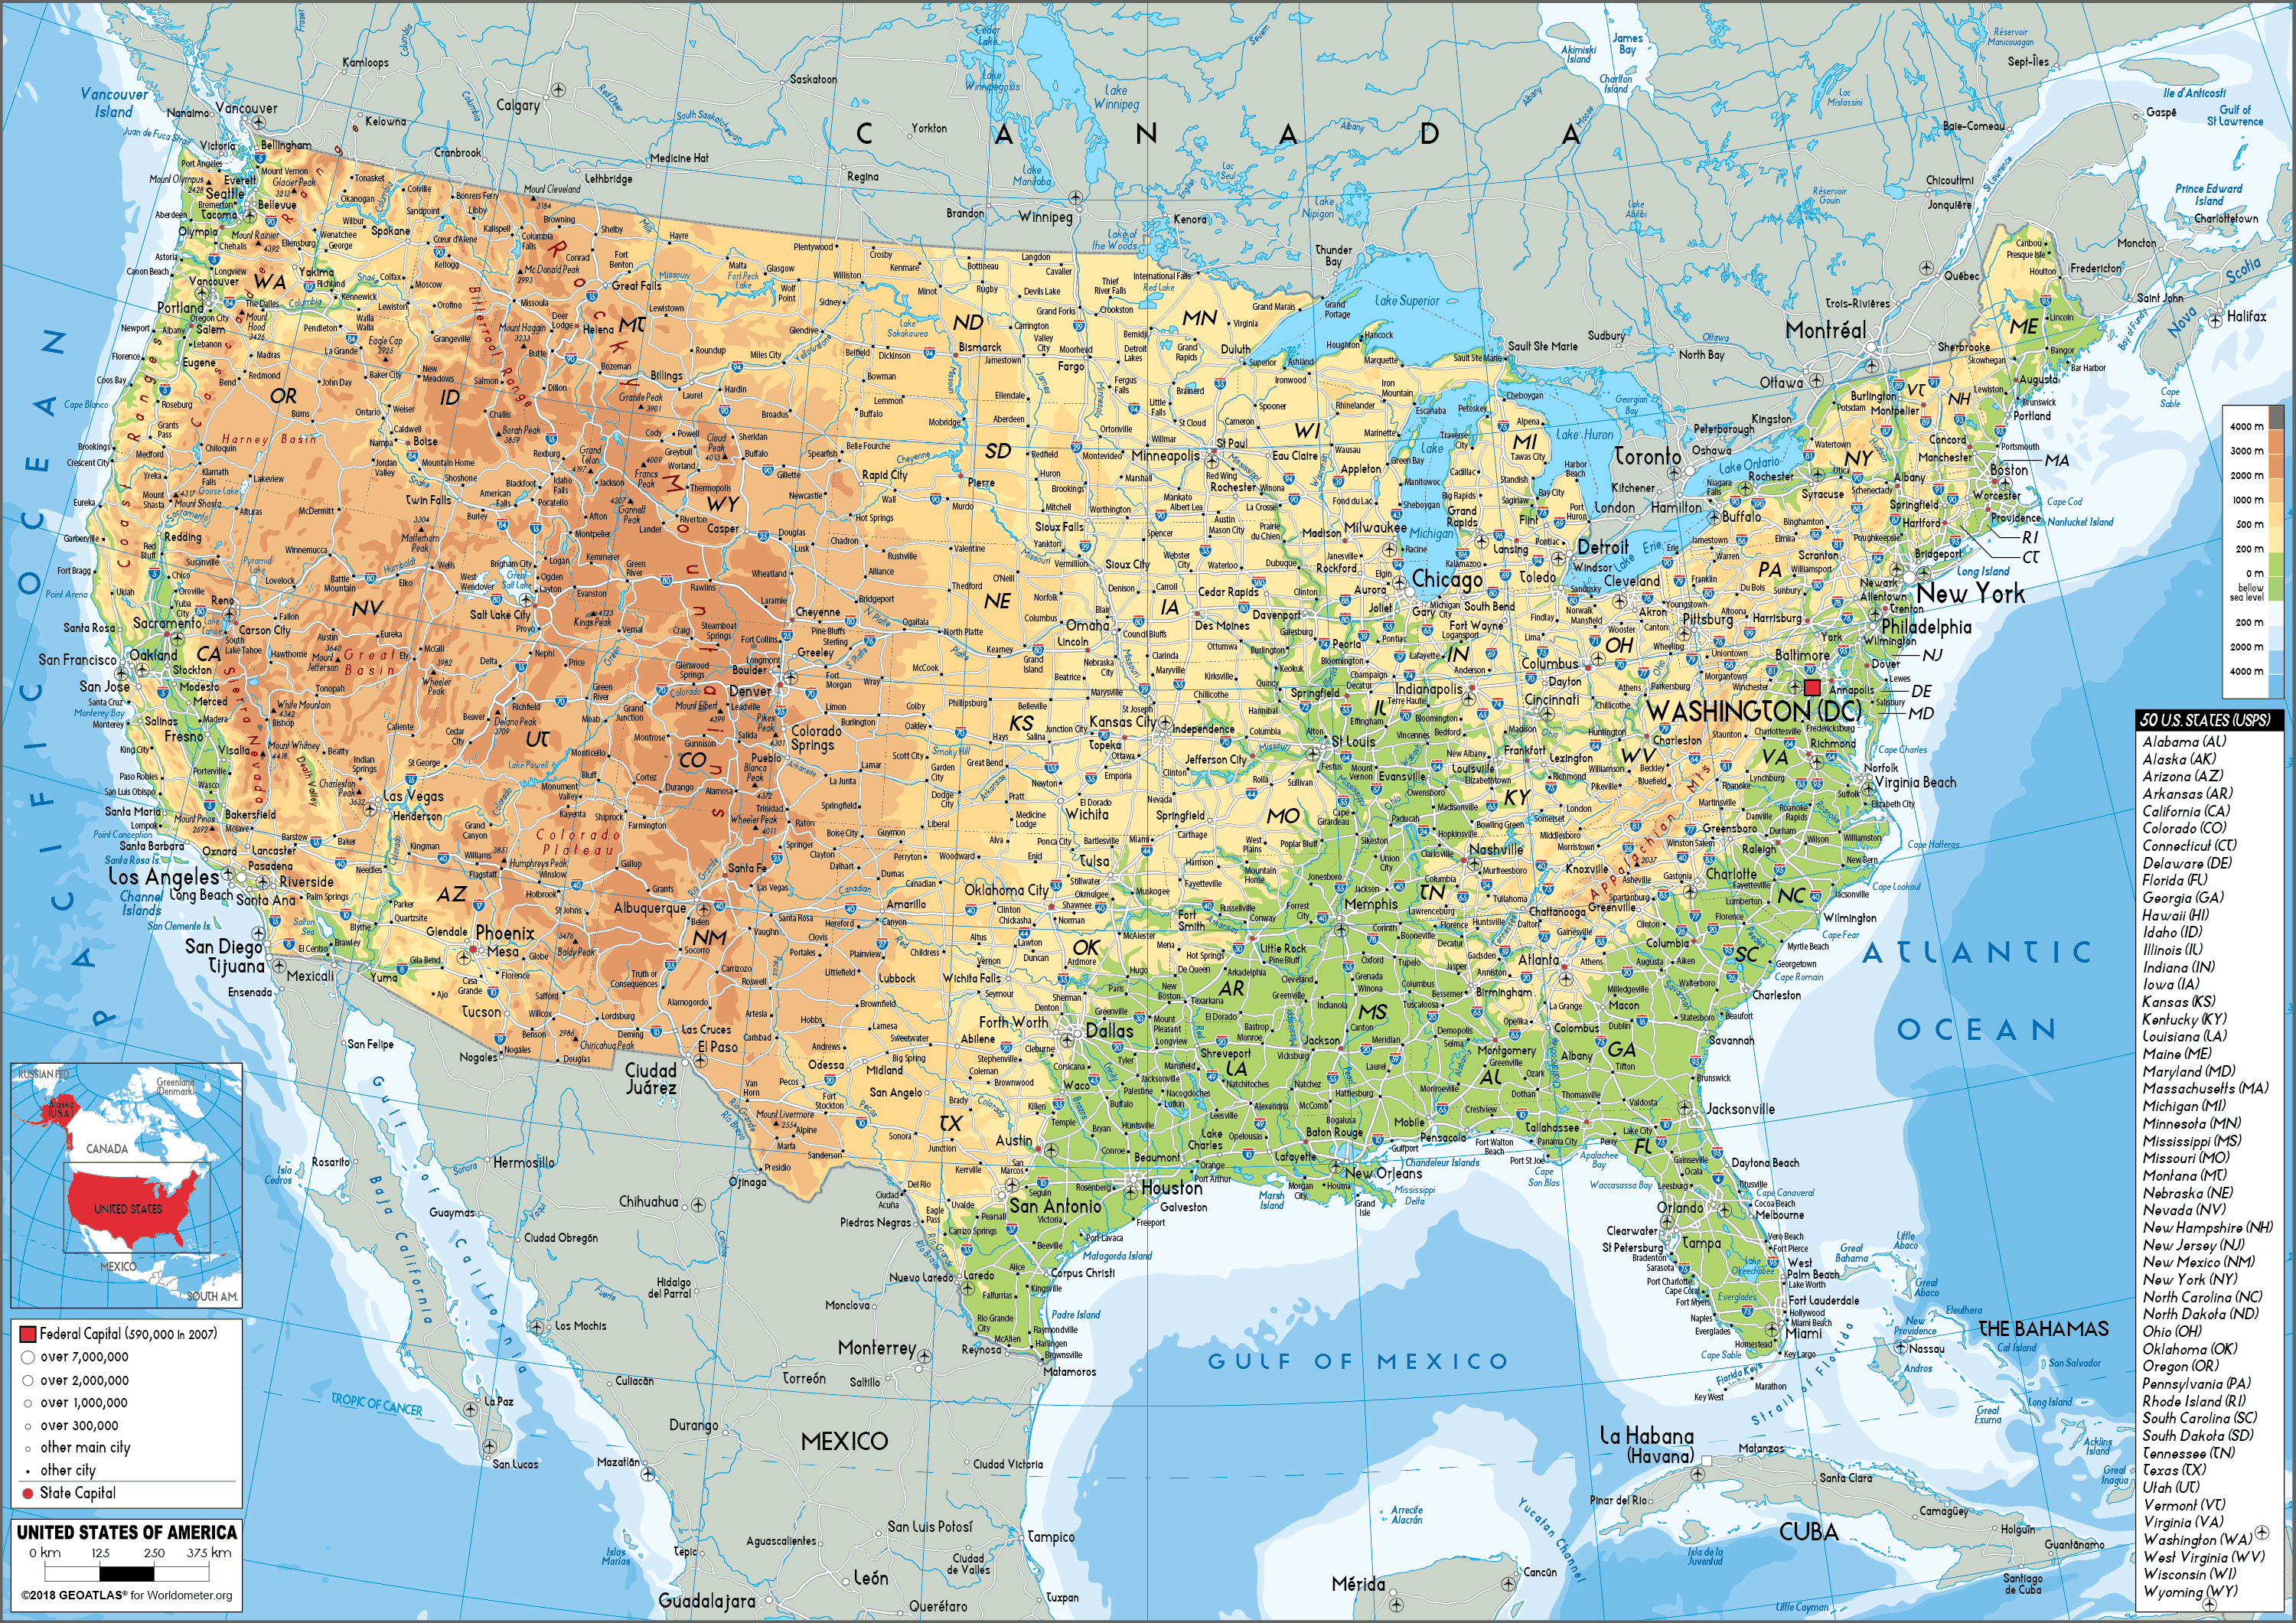
Large size Physical Map of the United States - Worldometer
Foto De Stock US Map, USA Map, United States Map, USA Map With State
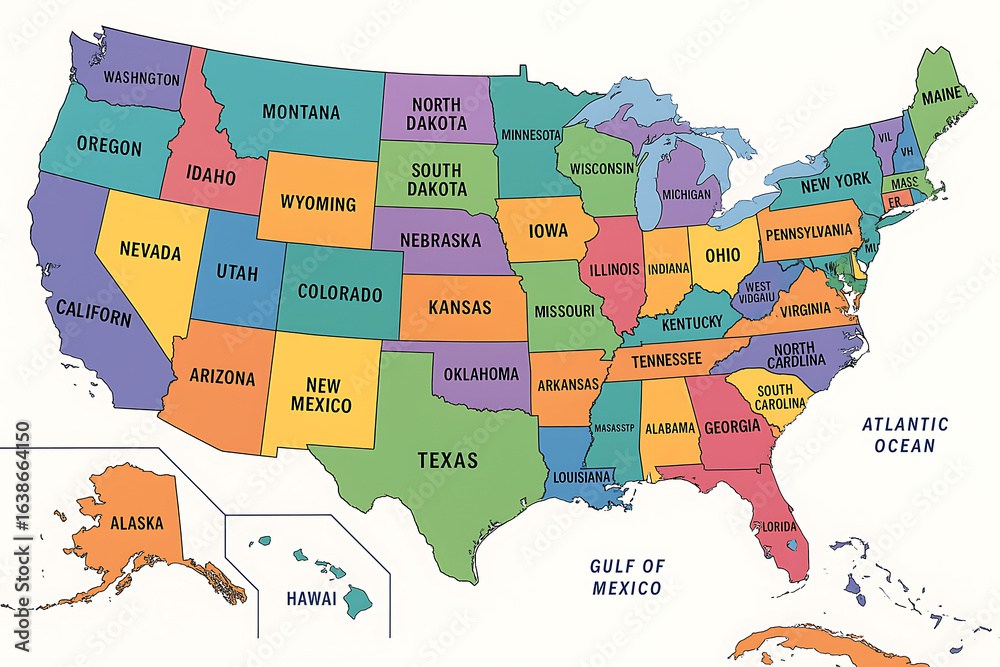
Foto de Stock US map, USA map, United States map, USA map with state ...
USA Map With States And Capitals Printable
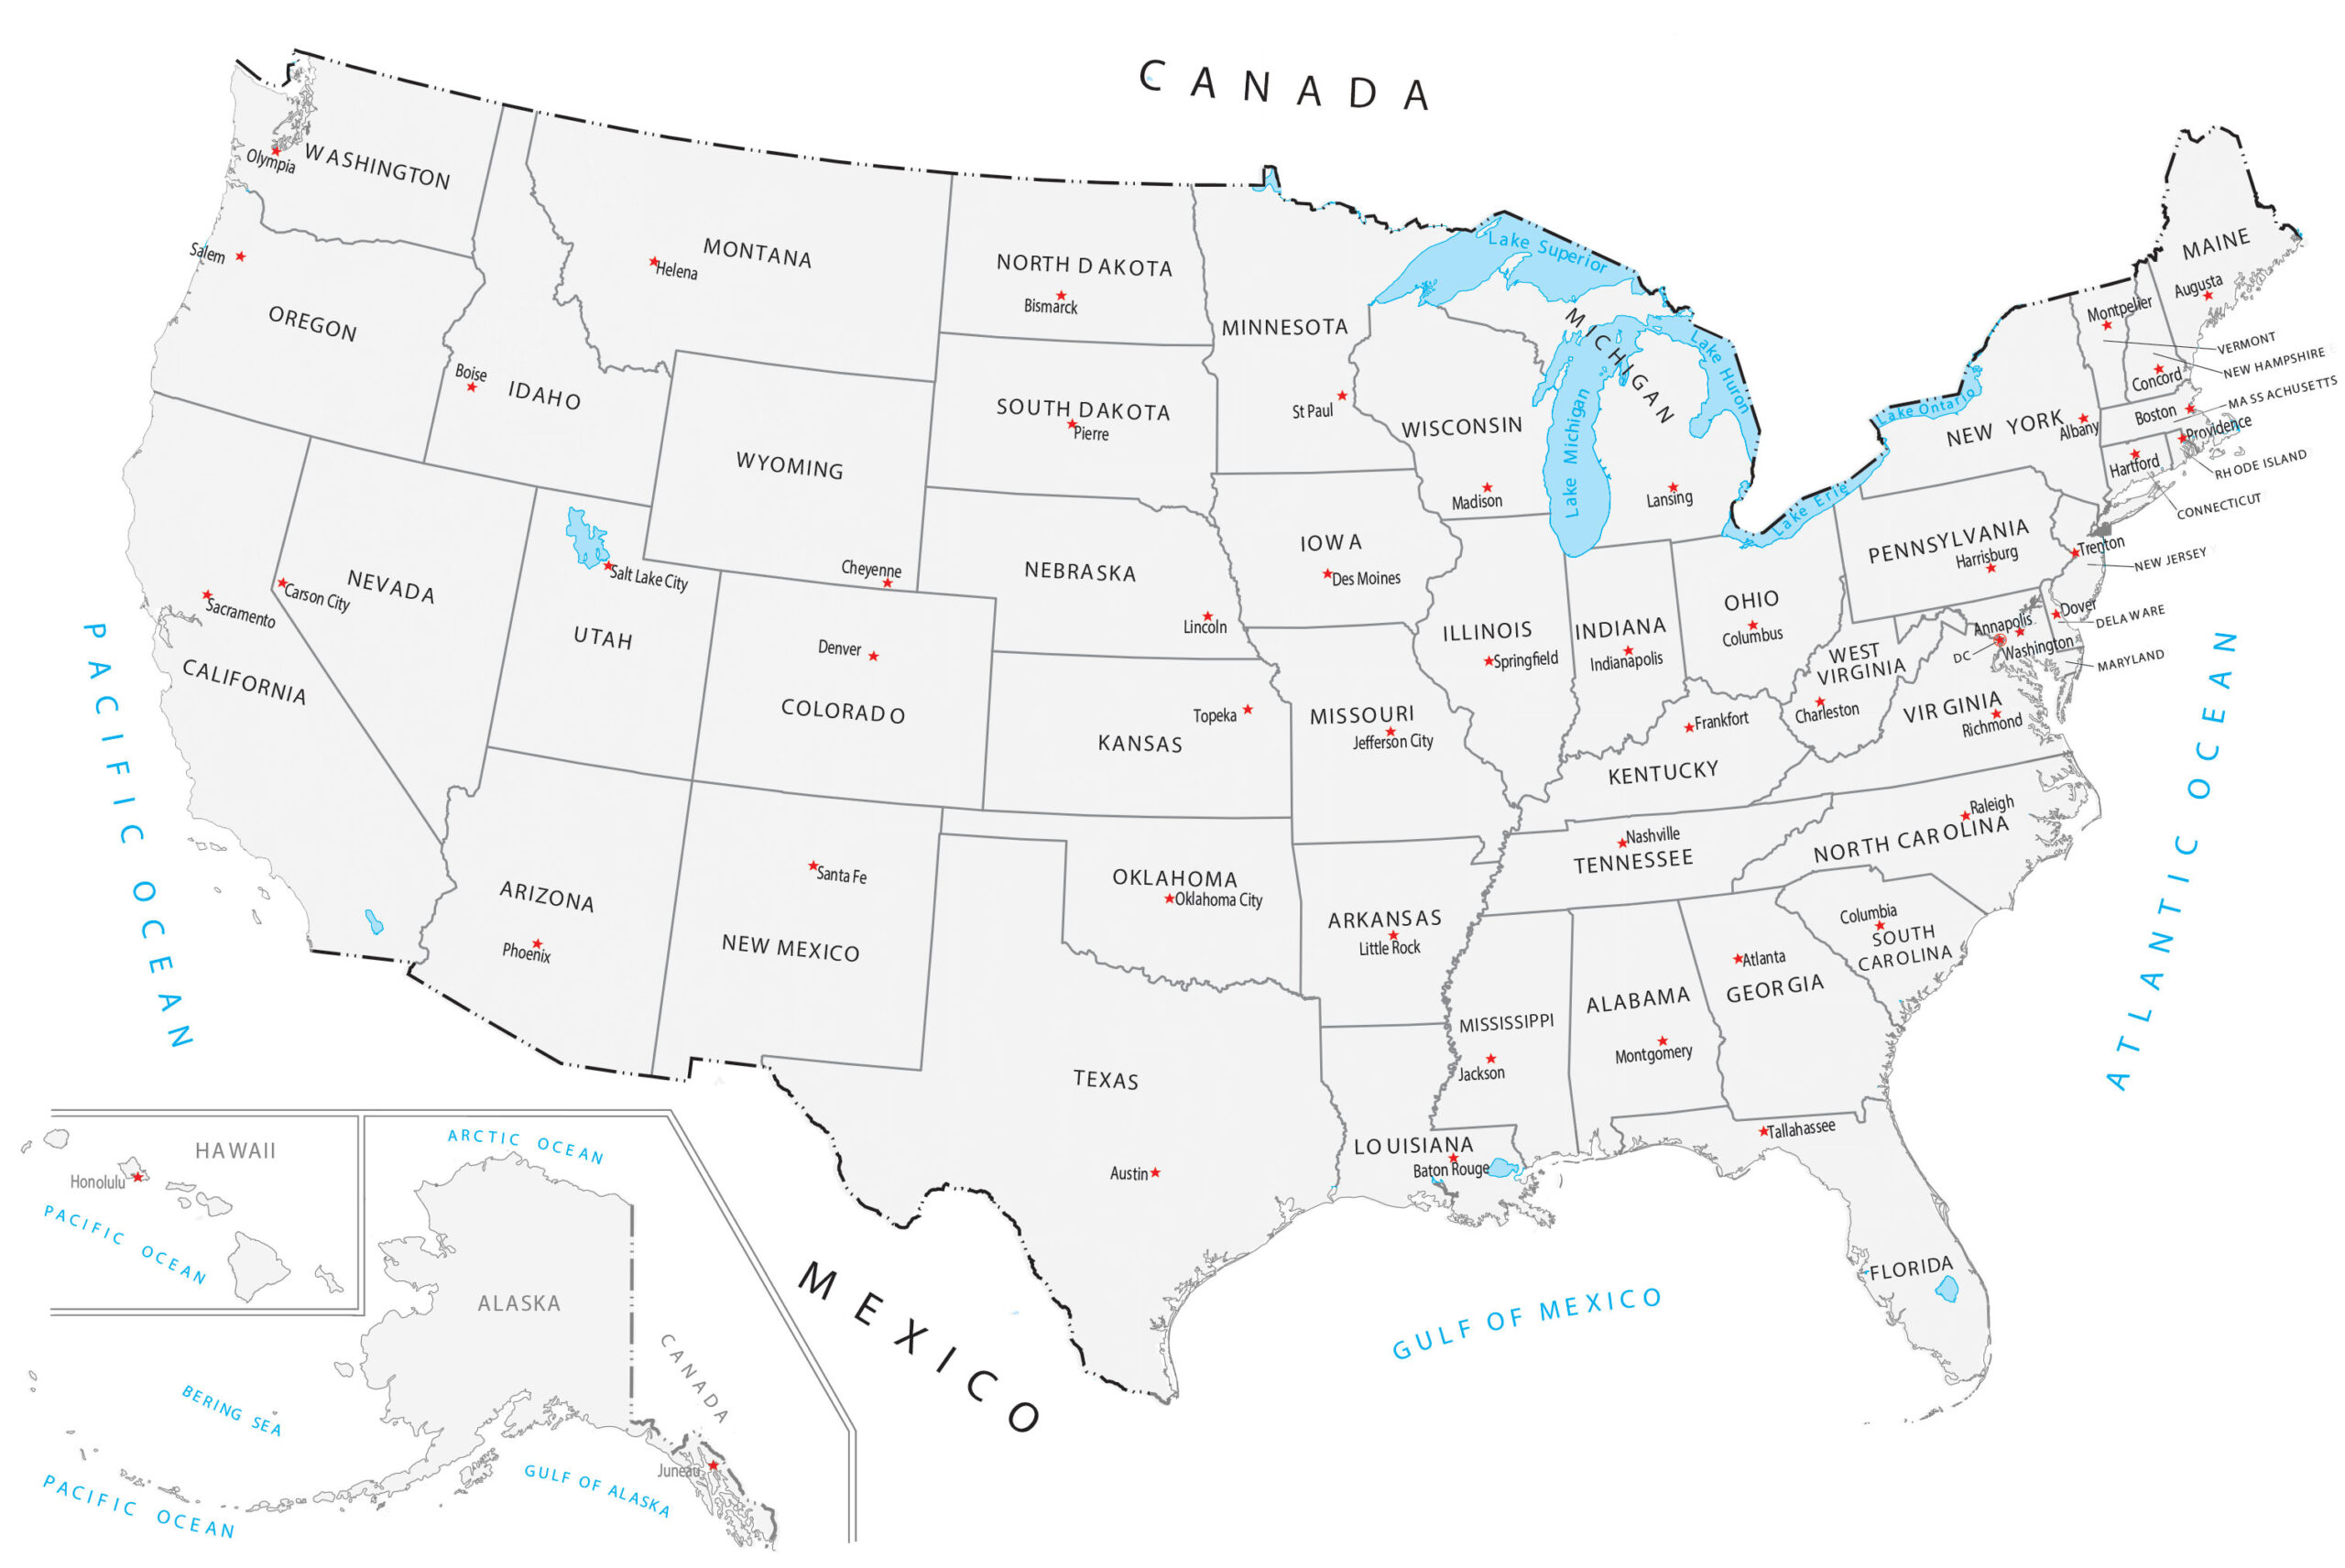
USA Map With States and Capitals Printable
Map Of United States
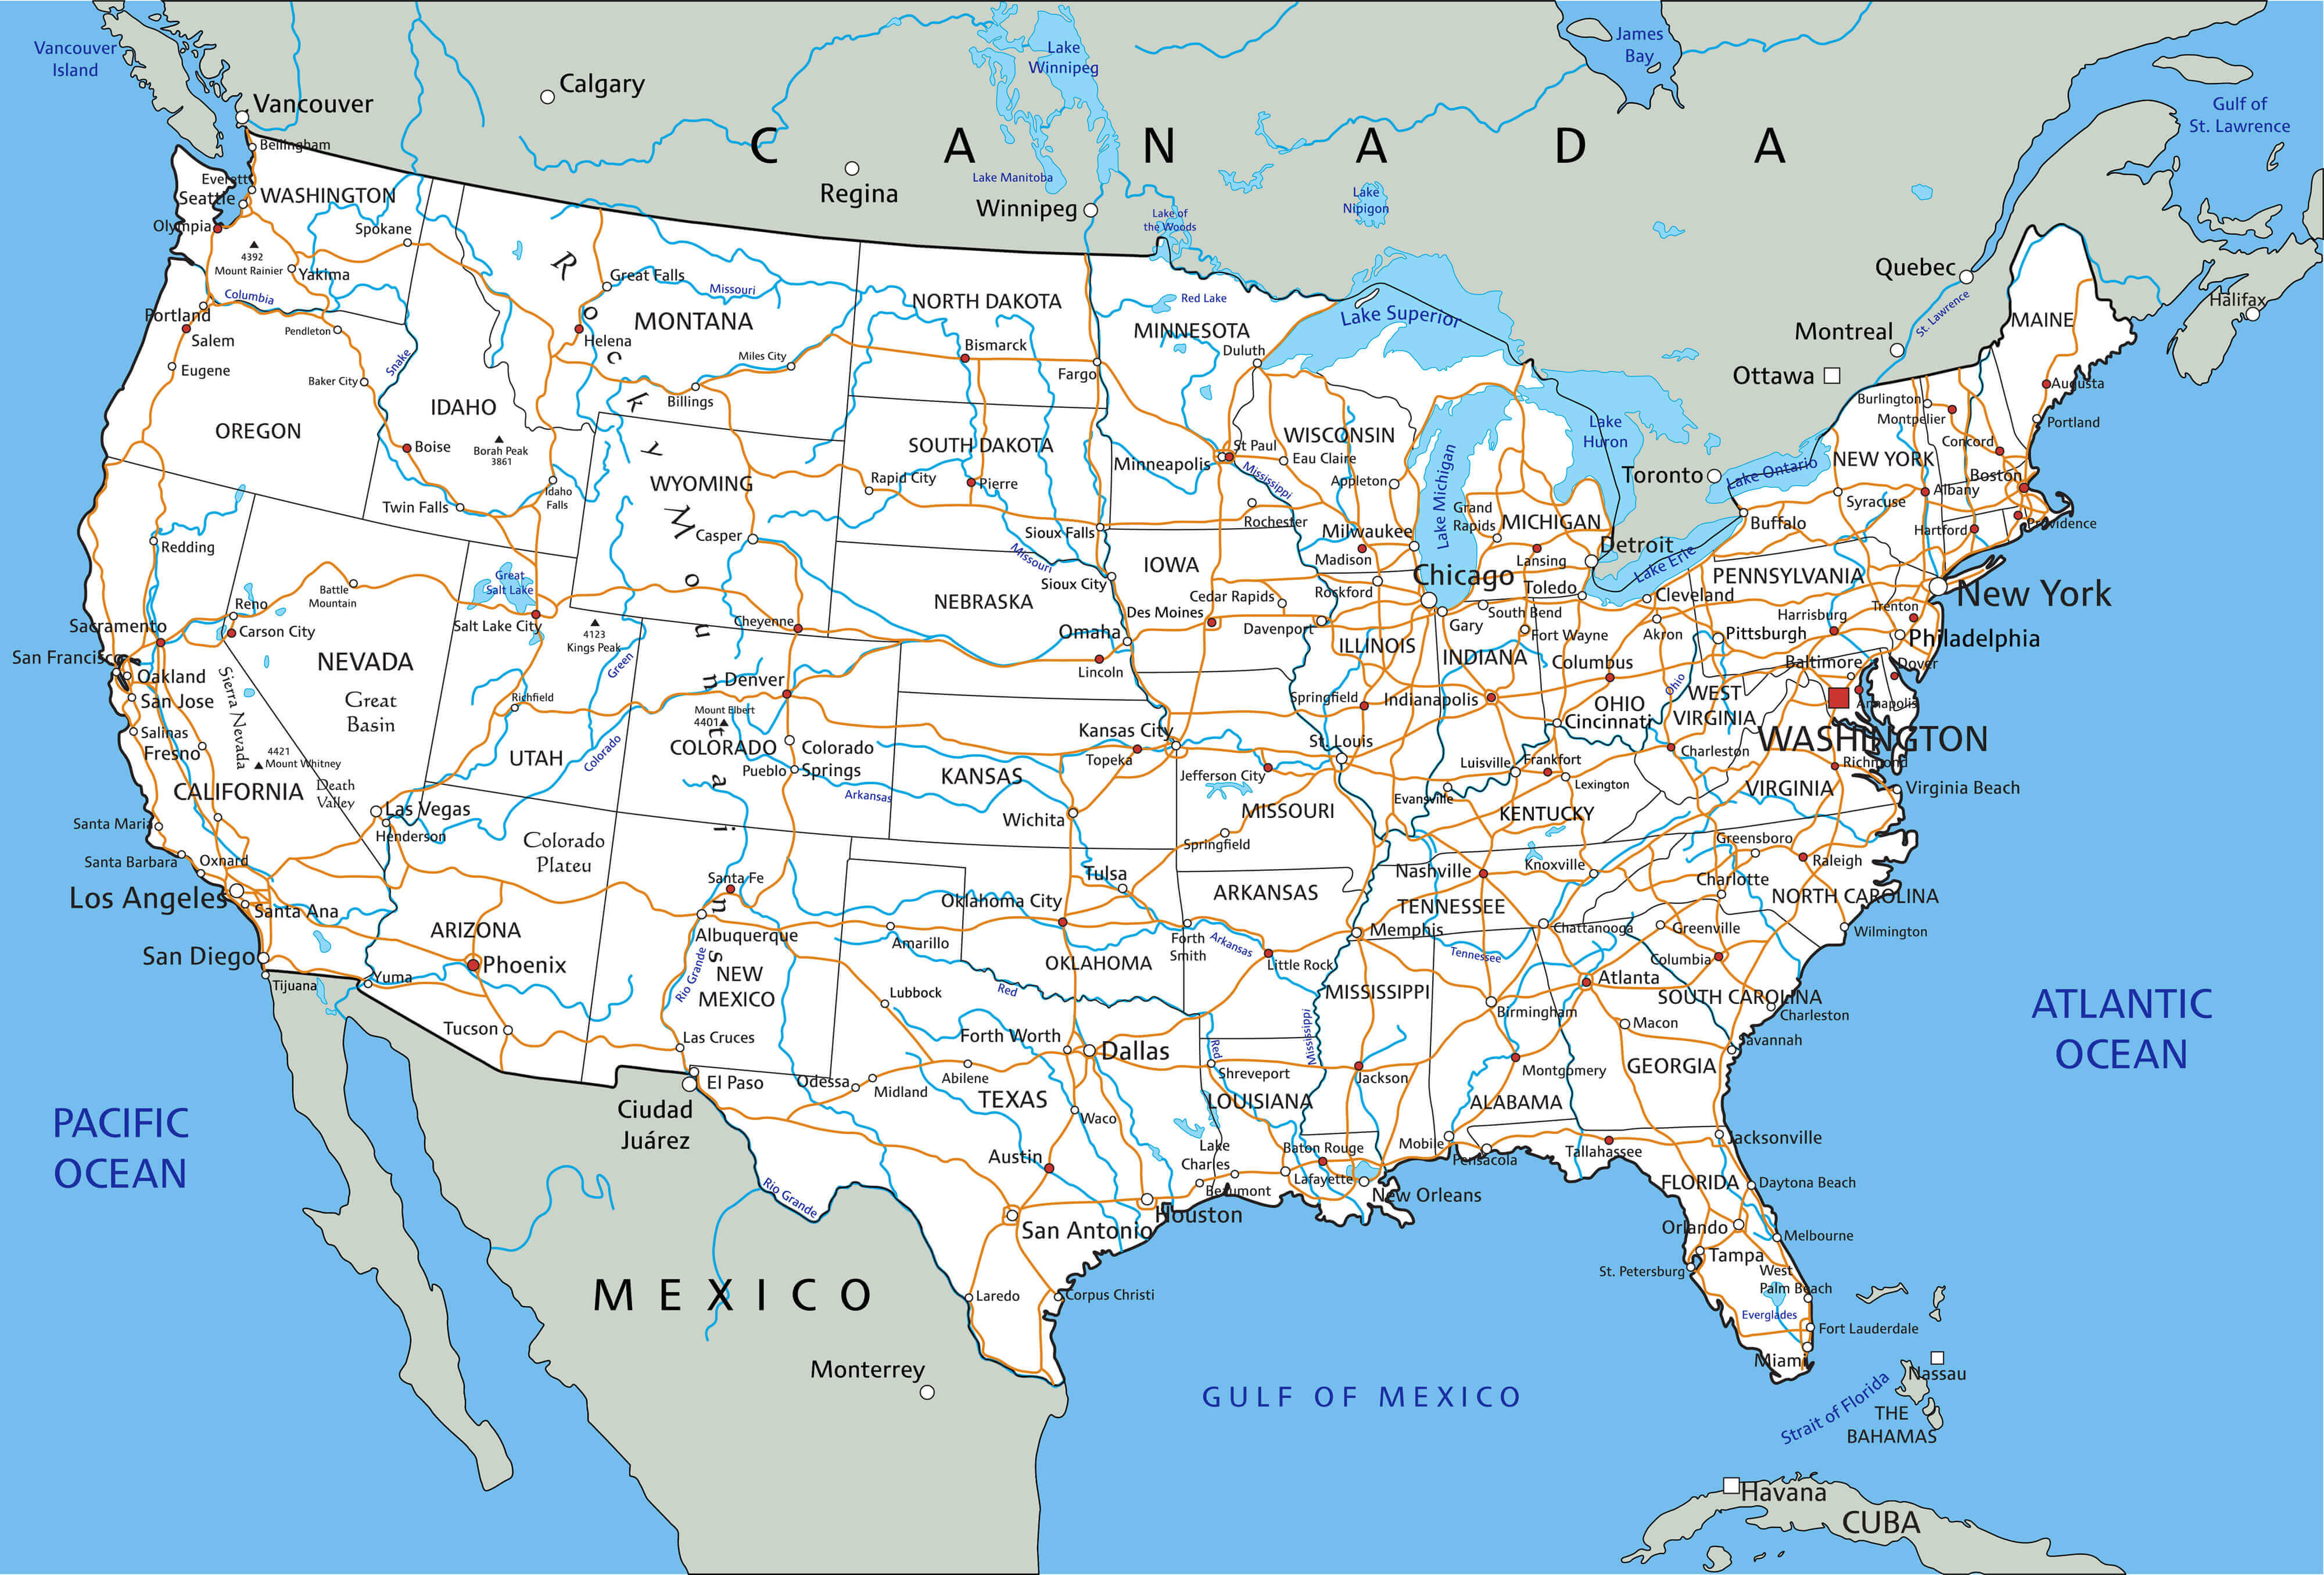
Map of United States
United States Labeled Map
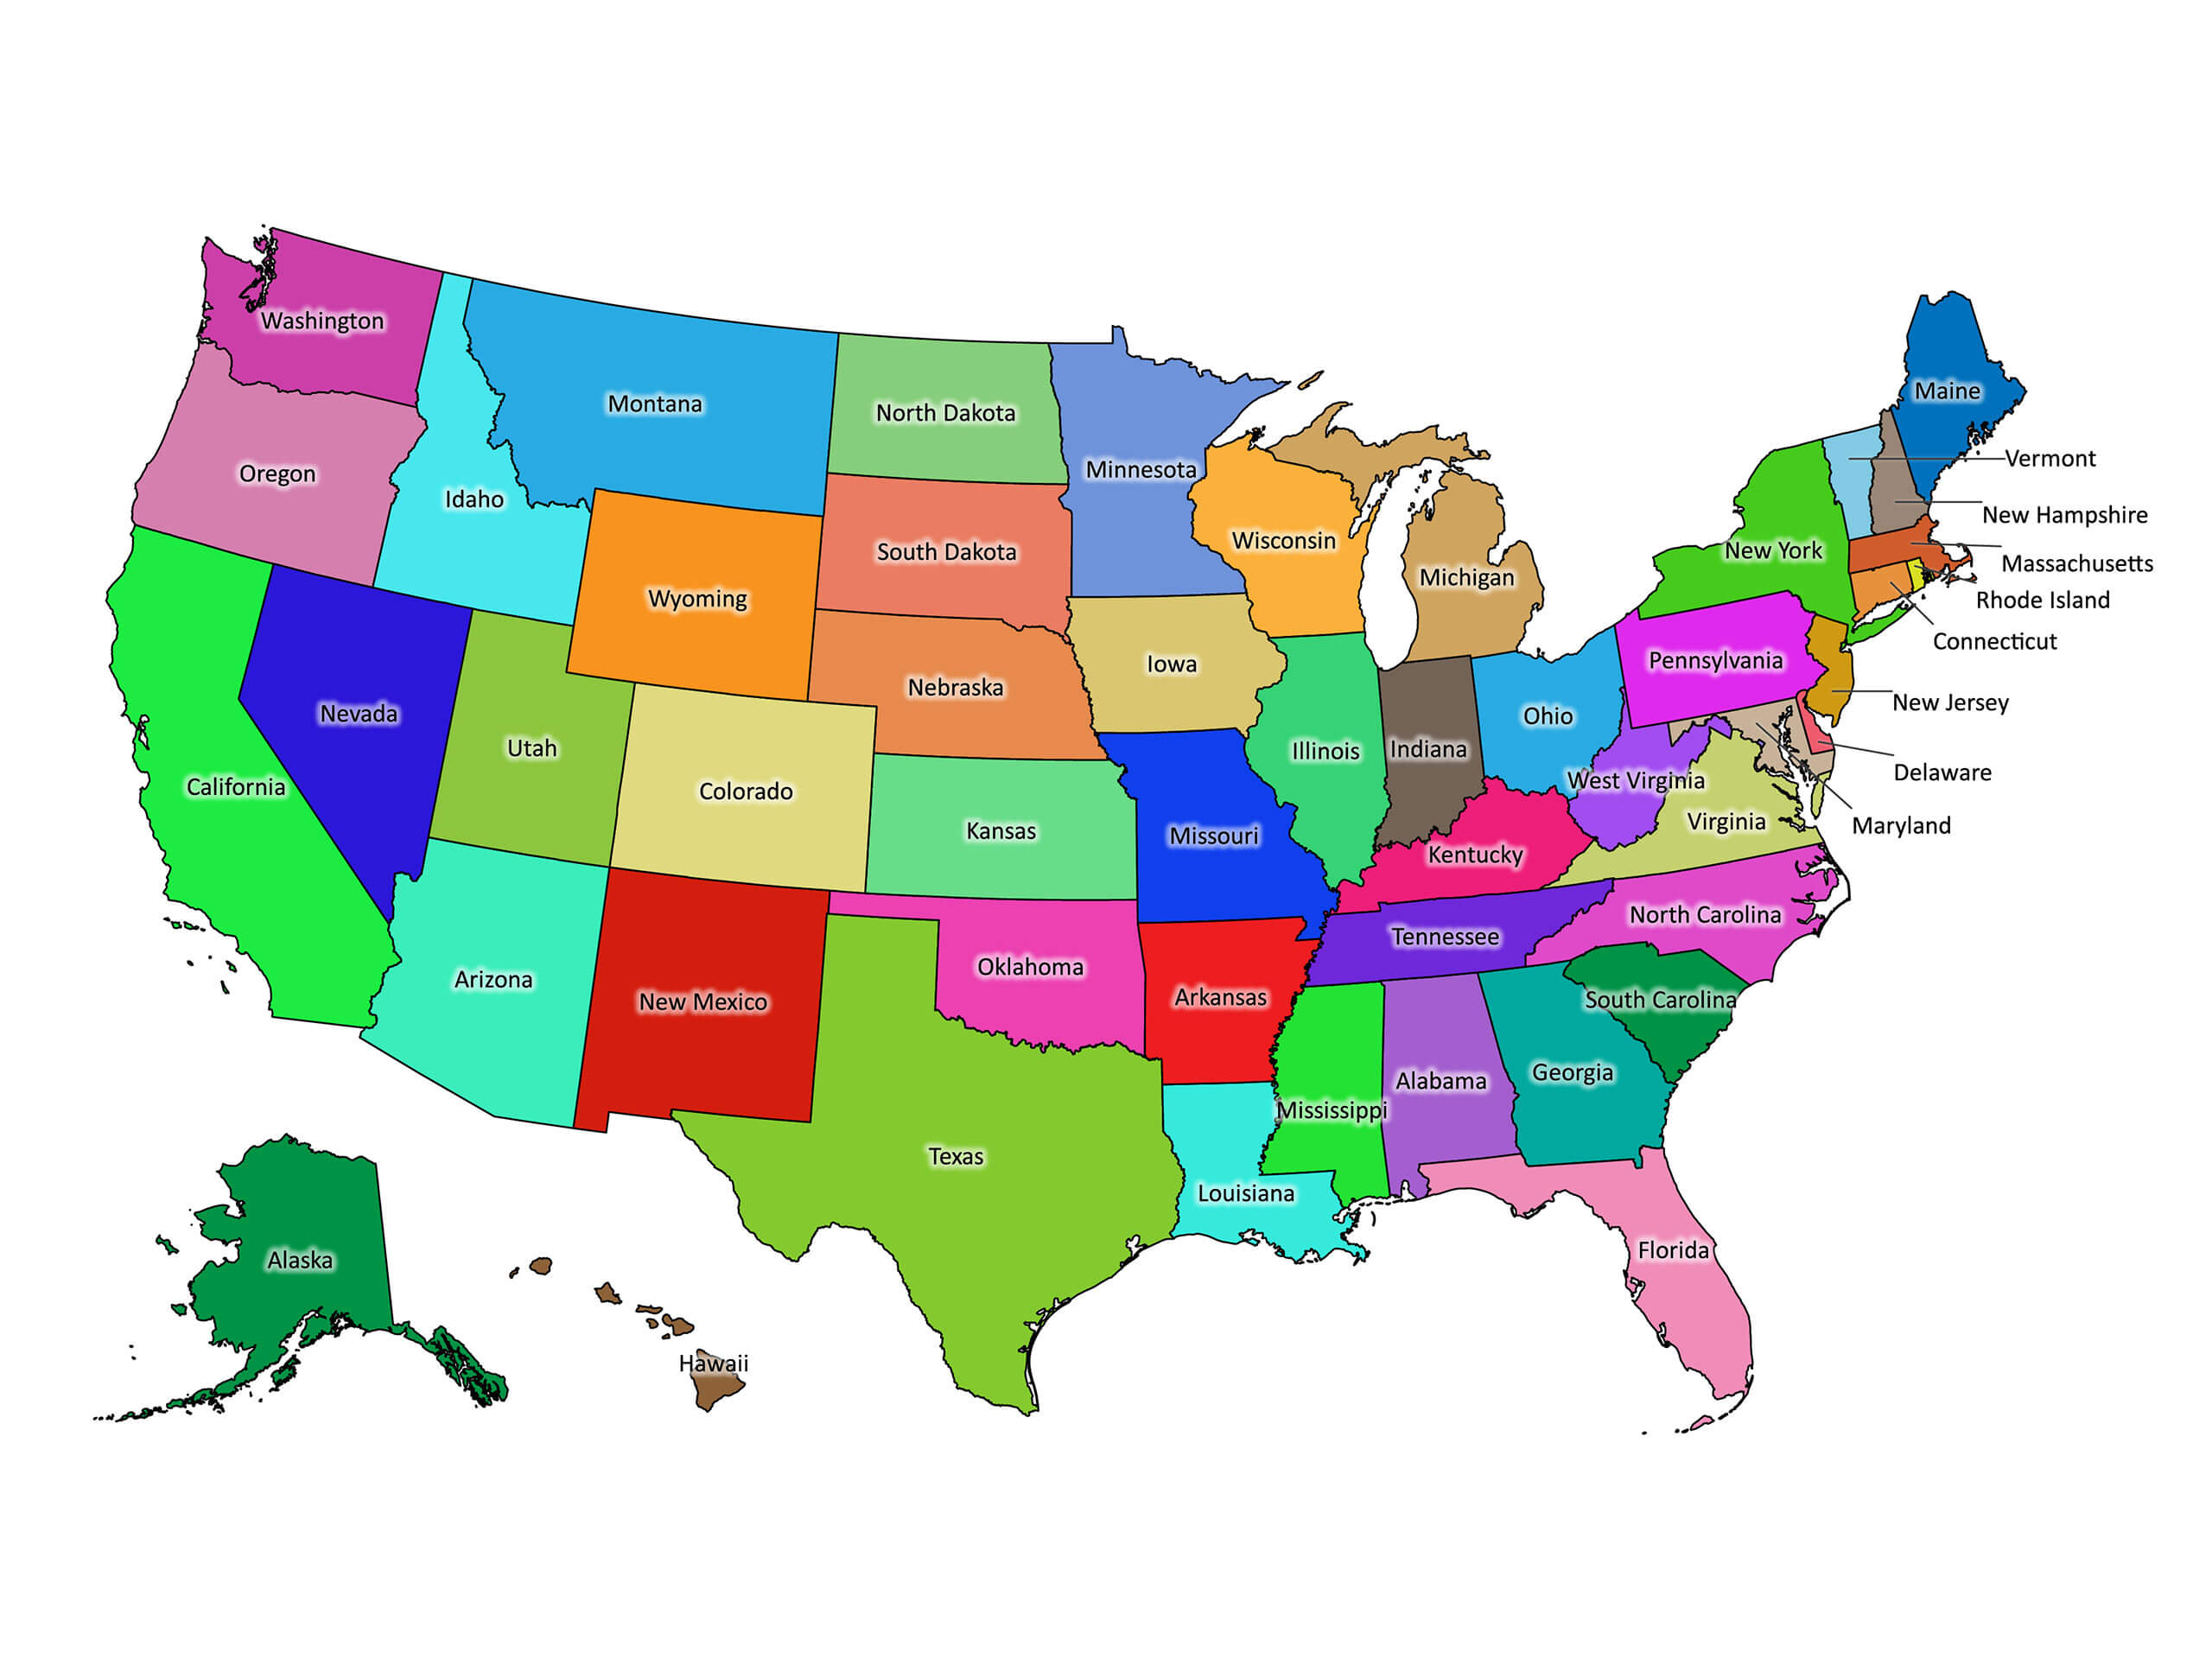
United States Labeled Map
United States Labeled Map 2000x2000
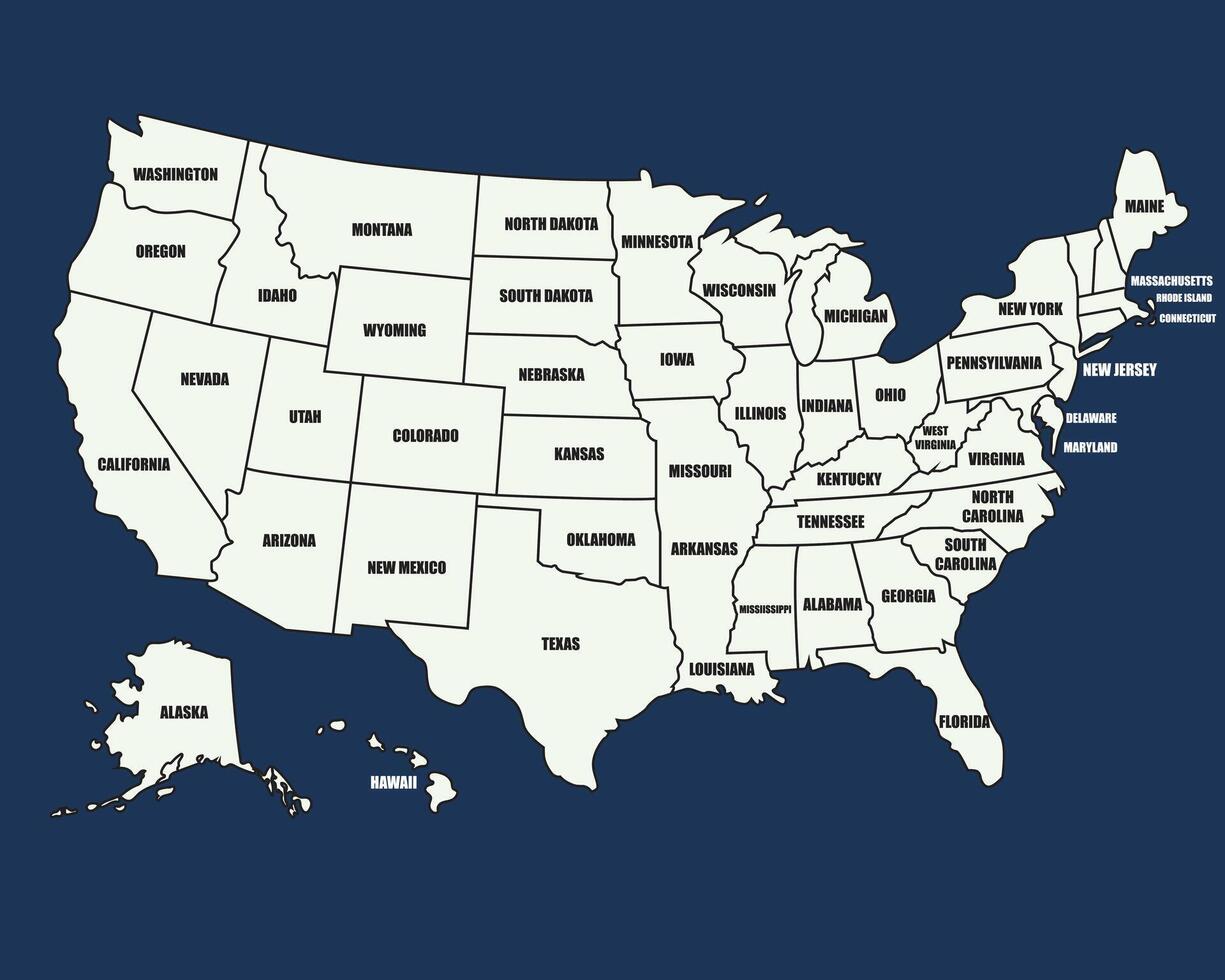
United States Labeled Map 2000x2000
Free Printable United States Map Color, Download Free Printable United

Free printable united states map color, Download Free printable united ...
World Maps Library - Complete Resources: Maps Of The United States With
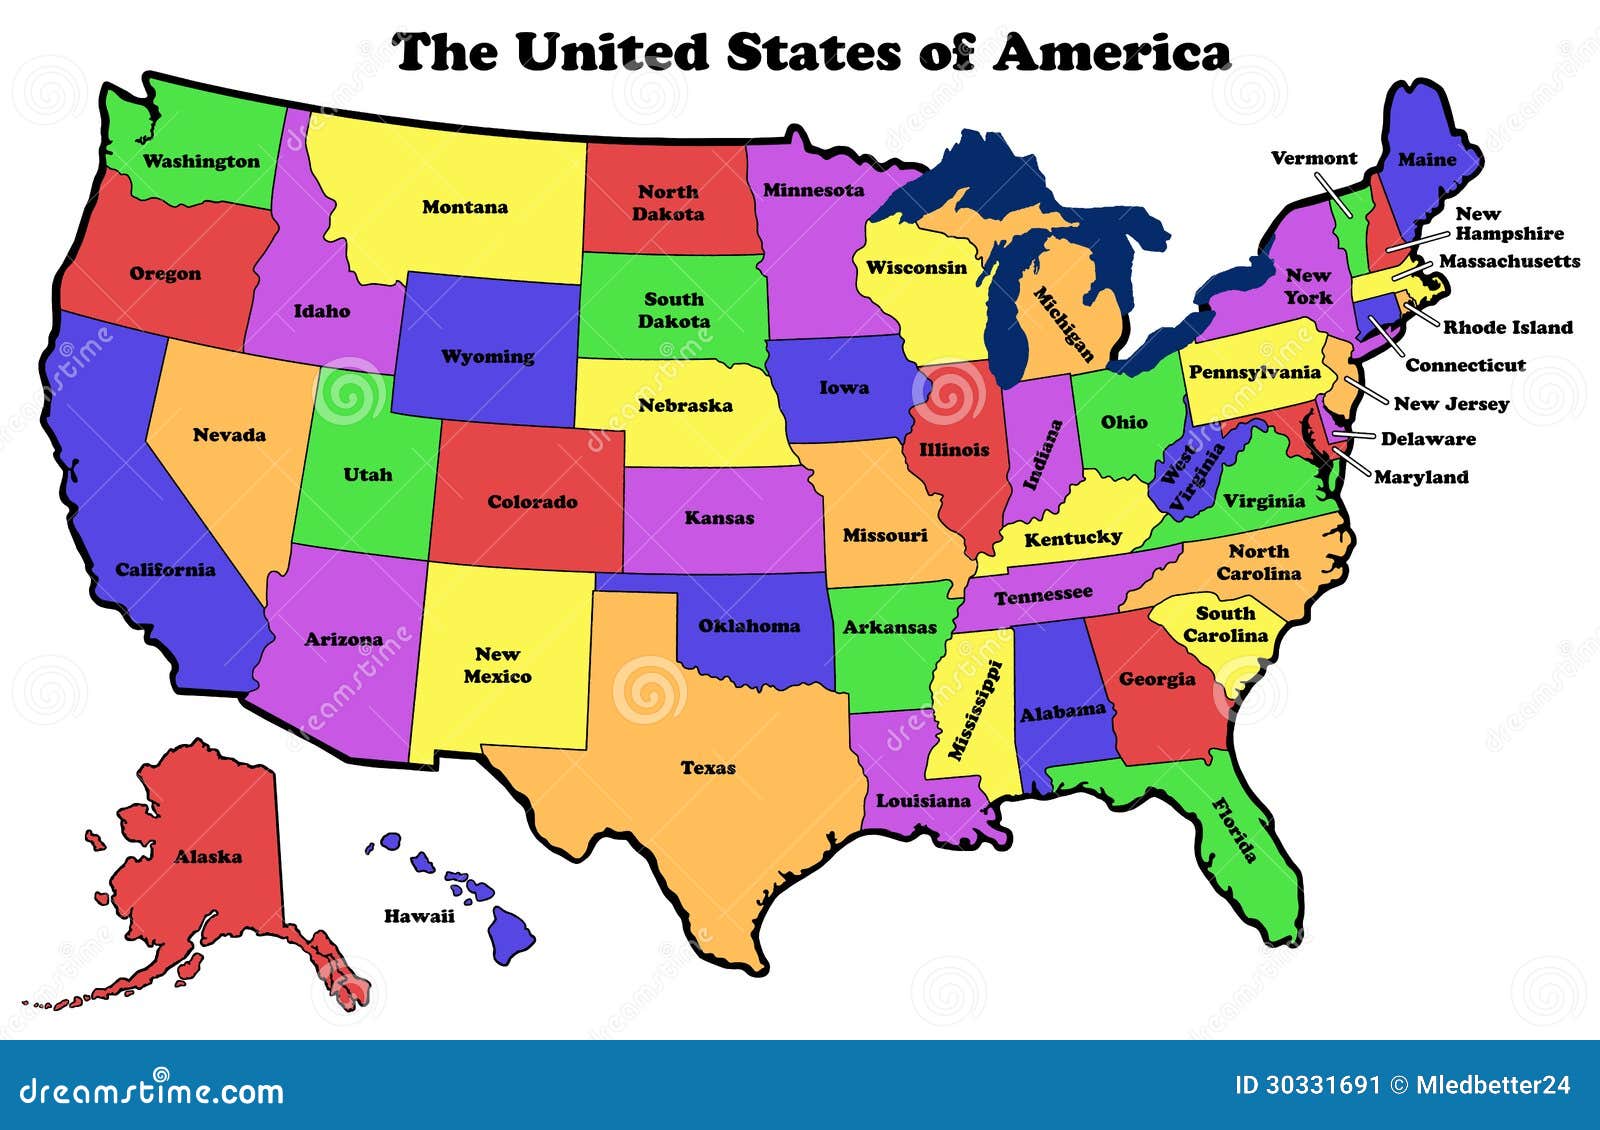
World Maps Library - Complete Resources: Maps Of The United States With ...
Free Printable USA Map: Download & Print Now! - Printables For Everyone
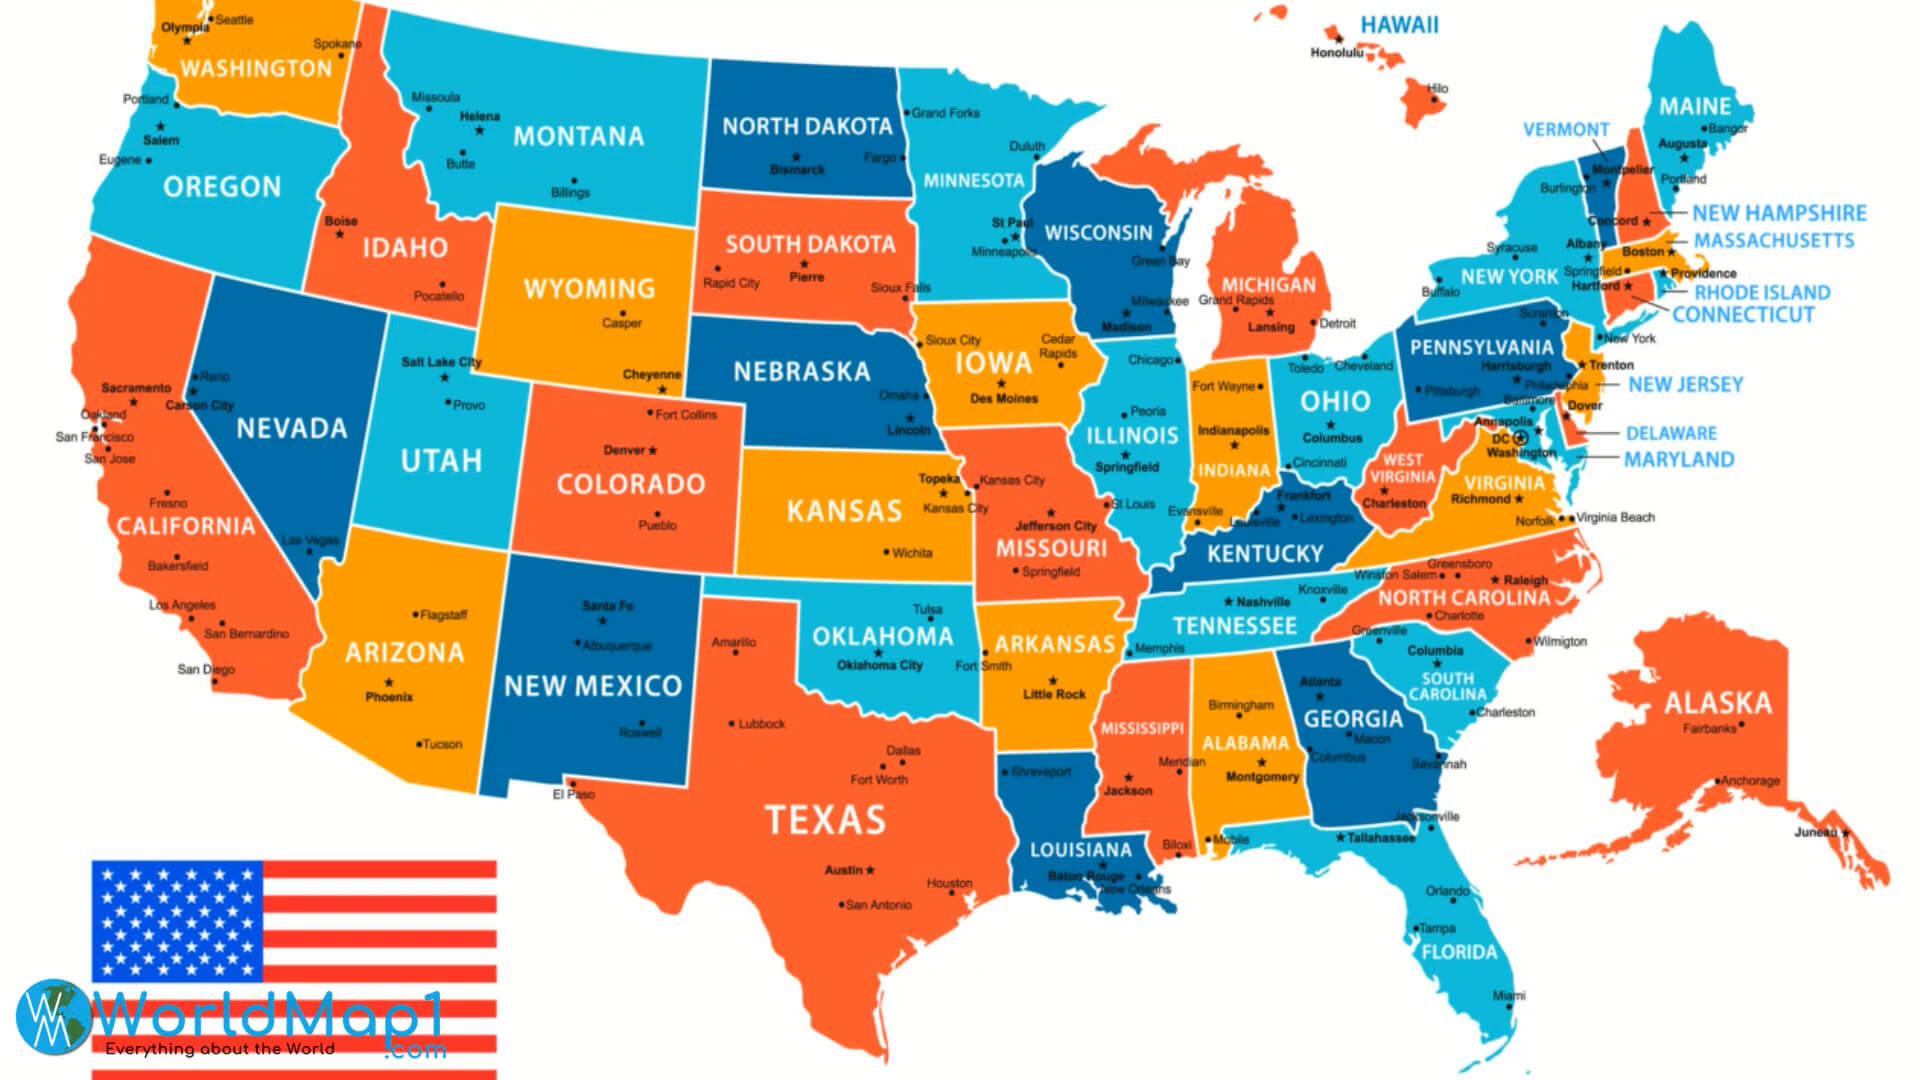
Free Printable USA Map: Download & Print Now! - Printables for Everyone
Map Of United States

Map of United States
United States Political Map

United States Political Map
US State Capitals Map - US Maps
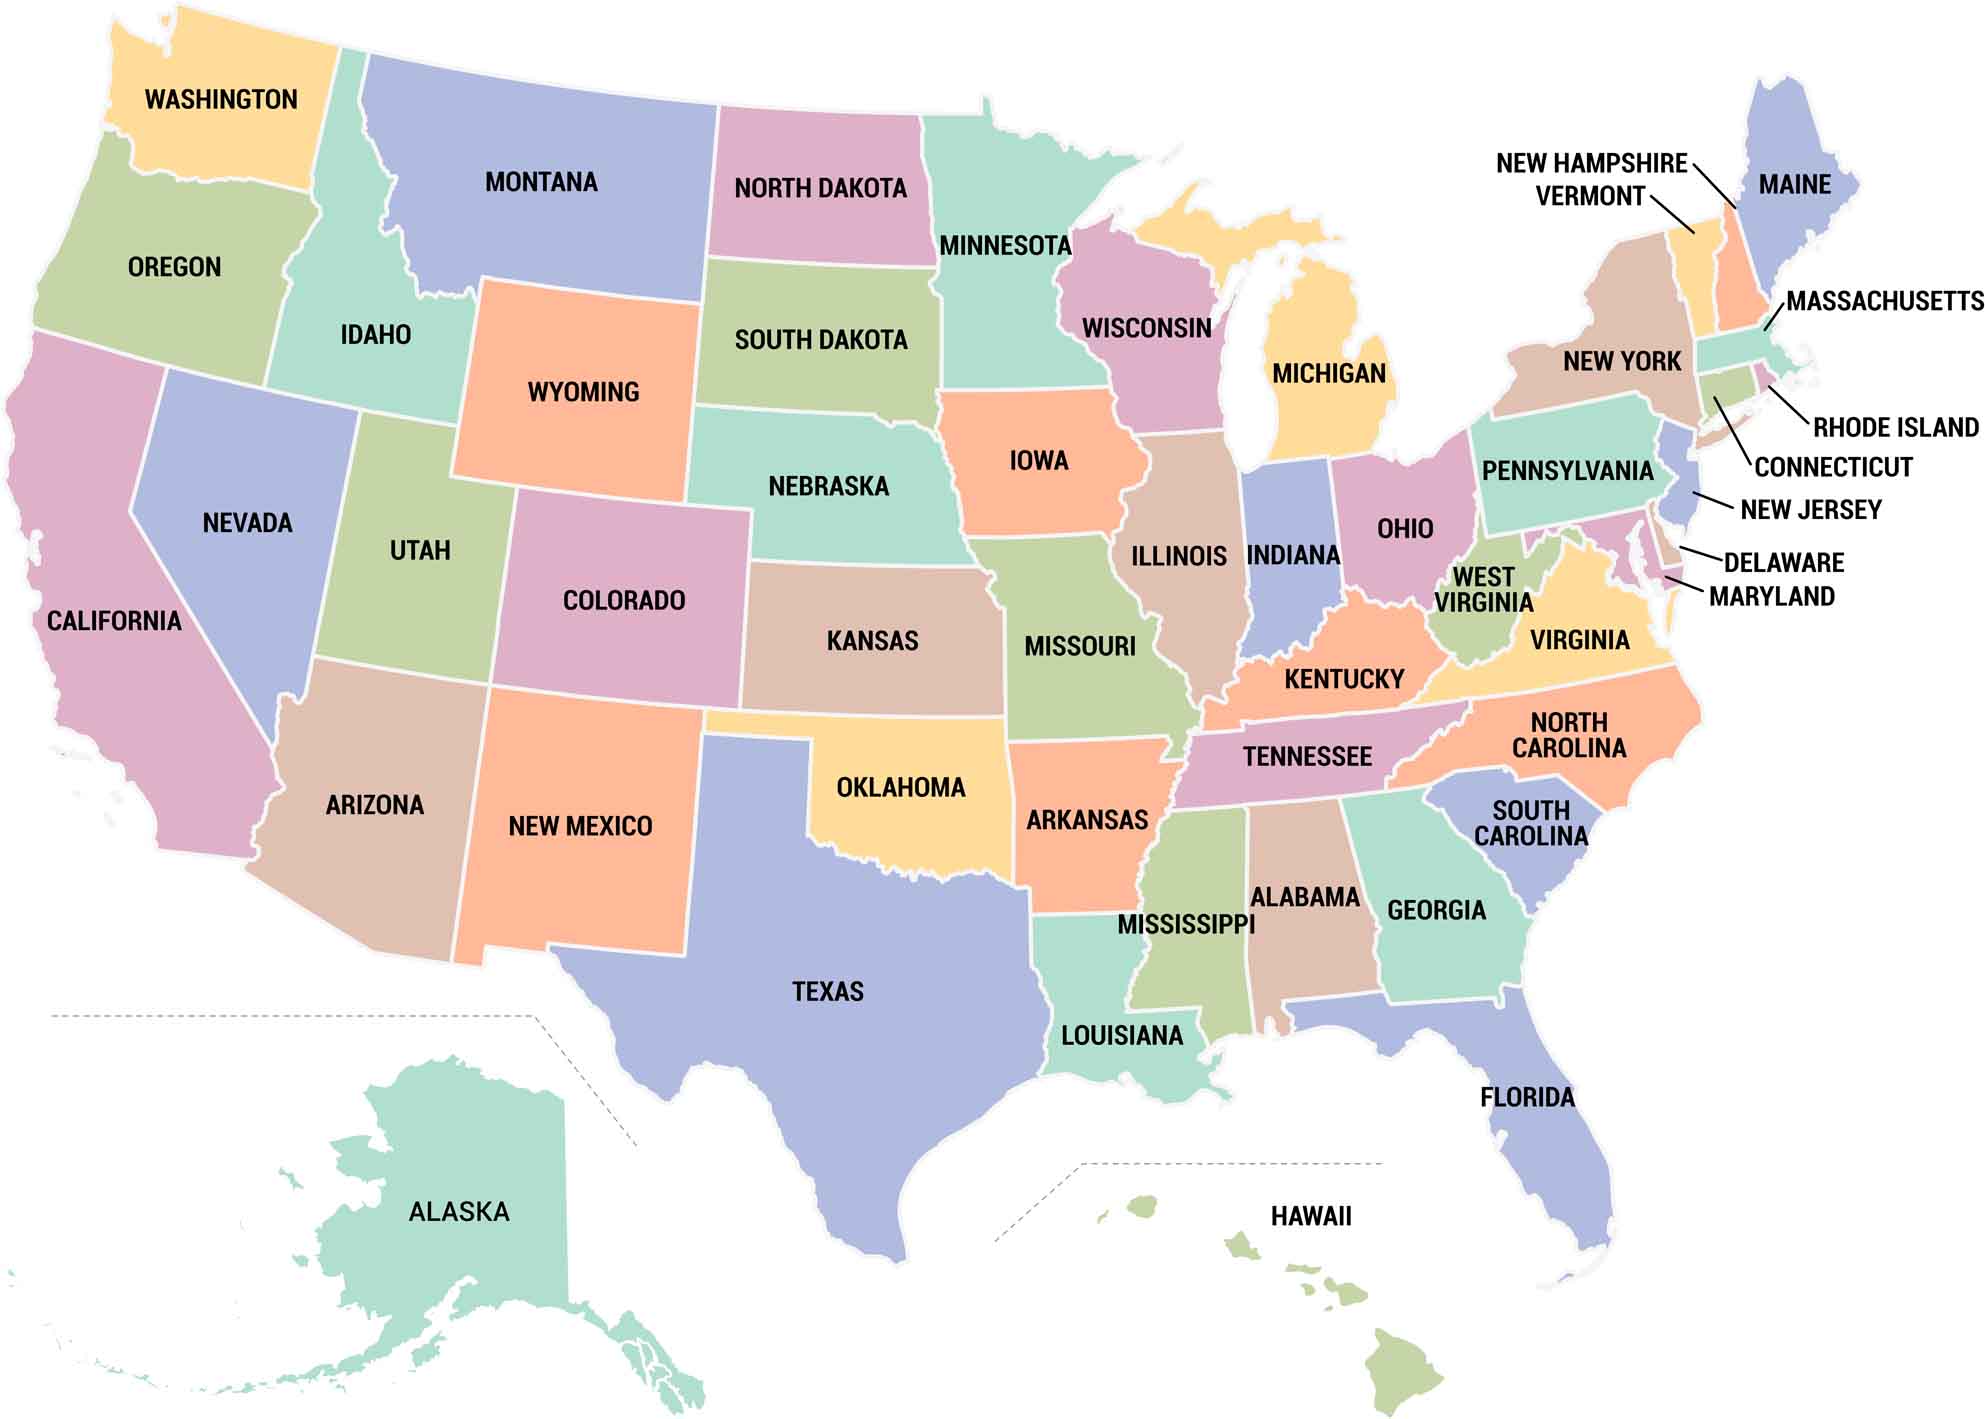
US State Capitals Map - US Maps
USA States Maps - Political And Geographic Boundaries
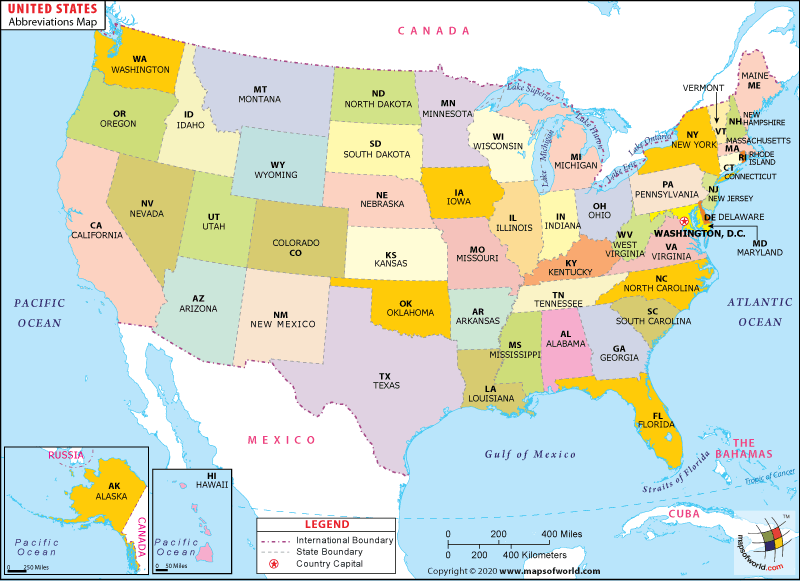
USA States Maps - Political and Geographic Boundaries
