Tracing the Evolution of the USA Map: A Chronological Journey
The map of the United States has long been a living document, reflecting territorial changes, political developments, and shifting cultural narratives. From the first cartographic representations of the thirteen colonies to the intricate outlines of modern state boundaries, each iteration tells a story of expansion, negotiation, and identity. This article explores key milestones in the history of the U.S. map, offering a concise yet comprehensive overview of how the country’s geographic footprint has evolved over time.
1. The Original 13 Colonies
The earliest American maps, created in the late 17th and early 18th centuries, focused on the Atlantic seaboard colonies that would become the United States. Cartographers such as John Smith and John Ogilby produced detailed charts of Virginia, Maryland, and New England, highlighting colonial settlements, rivers, and coastal features. These maps were primarily tools for navigation and colonial administration, emphasizing the economic importance of harbors and trade routes.
2. The 1763 Treaty of Paris and the First Continental Expansion
Following the Treaty of Paris, which ended the French and Indian War, Britain gained control of French territories east of the Mississippi River. Early maps began to incorporate the new lands, marking the western frontier and the boundaries of the colonies. Though still incomplete, these cartographic efforts set the stage for future territorial claims and underscored the growing American desire for westward expansion.
3. The Louisiana Purchase (1803)
Perhaps the most significant single acquisition in U.S. history, the Louisiana Purchase doubled the nation’s size. Cartographers like David Roberts and John Smith produced the first comprehensive maps that incorporated the vast Louisiana Territory. The new maps displayed a dramatic shift in national boundaries, highlighting the Mississippi River’s role as a natural demarcation line and marking the country’s first major westward leap.
4. The Compromise of 1850 and the Gadsden Purchase
The Compromise of 1850 addressed the balance between slave and free states, and the Gadsden Purchase in 1853 added land along the southern border, including parts of present-day Arizona and New Mexico. The maps from this era began to reflect the complex political negotiations that shaped the country’s internal divisions. The inclusion of the Gadsden Strip illustrated the U.S. government’s focus on securing a southern transcontinental railroad corridor.
5. The Civil War and the Union Blockade
During the American Civil War, maps served as strategic tools for both Union and Confederate forces. Detailed topographic maps of battlefields such as Antietam and Gettysburg were produced, incorporating elevations, troop positions, and logistical routes. The Union blockade of Confederate ports also demanded accurate maritime charts, highlighting the importance of precise cartography for military success and national security.
6. The Westward Manifest Destiny and the Completion of the Transcontinental Railroad (1869)
The completion of the Transcontinental Railroad in 1869 marked a pivotal moment in the nation’s geographic unification. Updated maps displayed the newly connected rail network, showing the link between the Atlantic and Pacific coasts. The railroad’s presence reshaped the economic and demographic landscape, prompting maps to emphasize new transportation hubs and the movement of settlers across the frontier.
7. The Statehood of the Western Territories (1907–1959)
Between 1907 and 1959, several territories—North Dakota, South Dakota, Montana, Washington, Wyoming, Oklahoma, New Mexico, Arizona, and Alaska—were admitted as states. Each state’s entrance required revisions to U.S. maps, reflecting new borders and the addition of political subdivisions. The inclusion of Alaska in 1959 was a notable geographic expansion, and contemporary maps began to display the continent’s northernmost territories with increased detail.
8. The Rise of Digital Cartography and Interactive Maps (1990s–Present)
From the 1990s onward, advances in digital technology transformed how maps are created and consumed. Geographic Information Systems (GIS) enabled the layering of demographic data, environmental factors, and real-time traffic updates. The proliferation of online mapping services such as Google Maps and OpenStreetMap democratized access, allowing users to view the U.S. map in unprecedented detail and interactivity, and ushering in a new era of dynamic, data-driven cartography.
9. Contemporary Challenges and Future Directions
Today, maps continue to grapple with political and environmental issues, from debates over border security to the implications of climate change on coastal boundaries. Future cartographic projects will likely incorporate predictive modeling of sea-level rise, urban sprawl, and shifting political districts. These evolving maps will remain essential tools for policy makers, planners, and the public, ensuring that the geographic representation of the United States stays accurate and relevant.
Fourteen Maps Of The United States: Territorial Growth 1775-1970
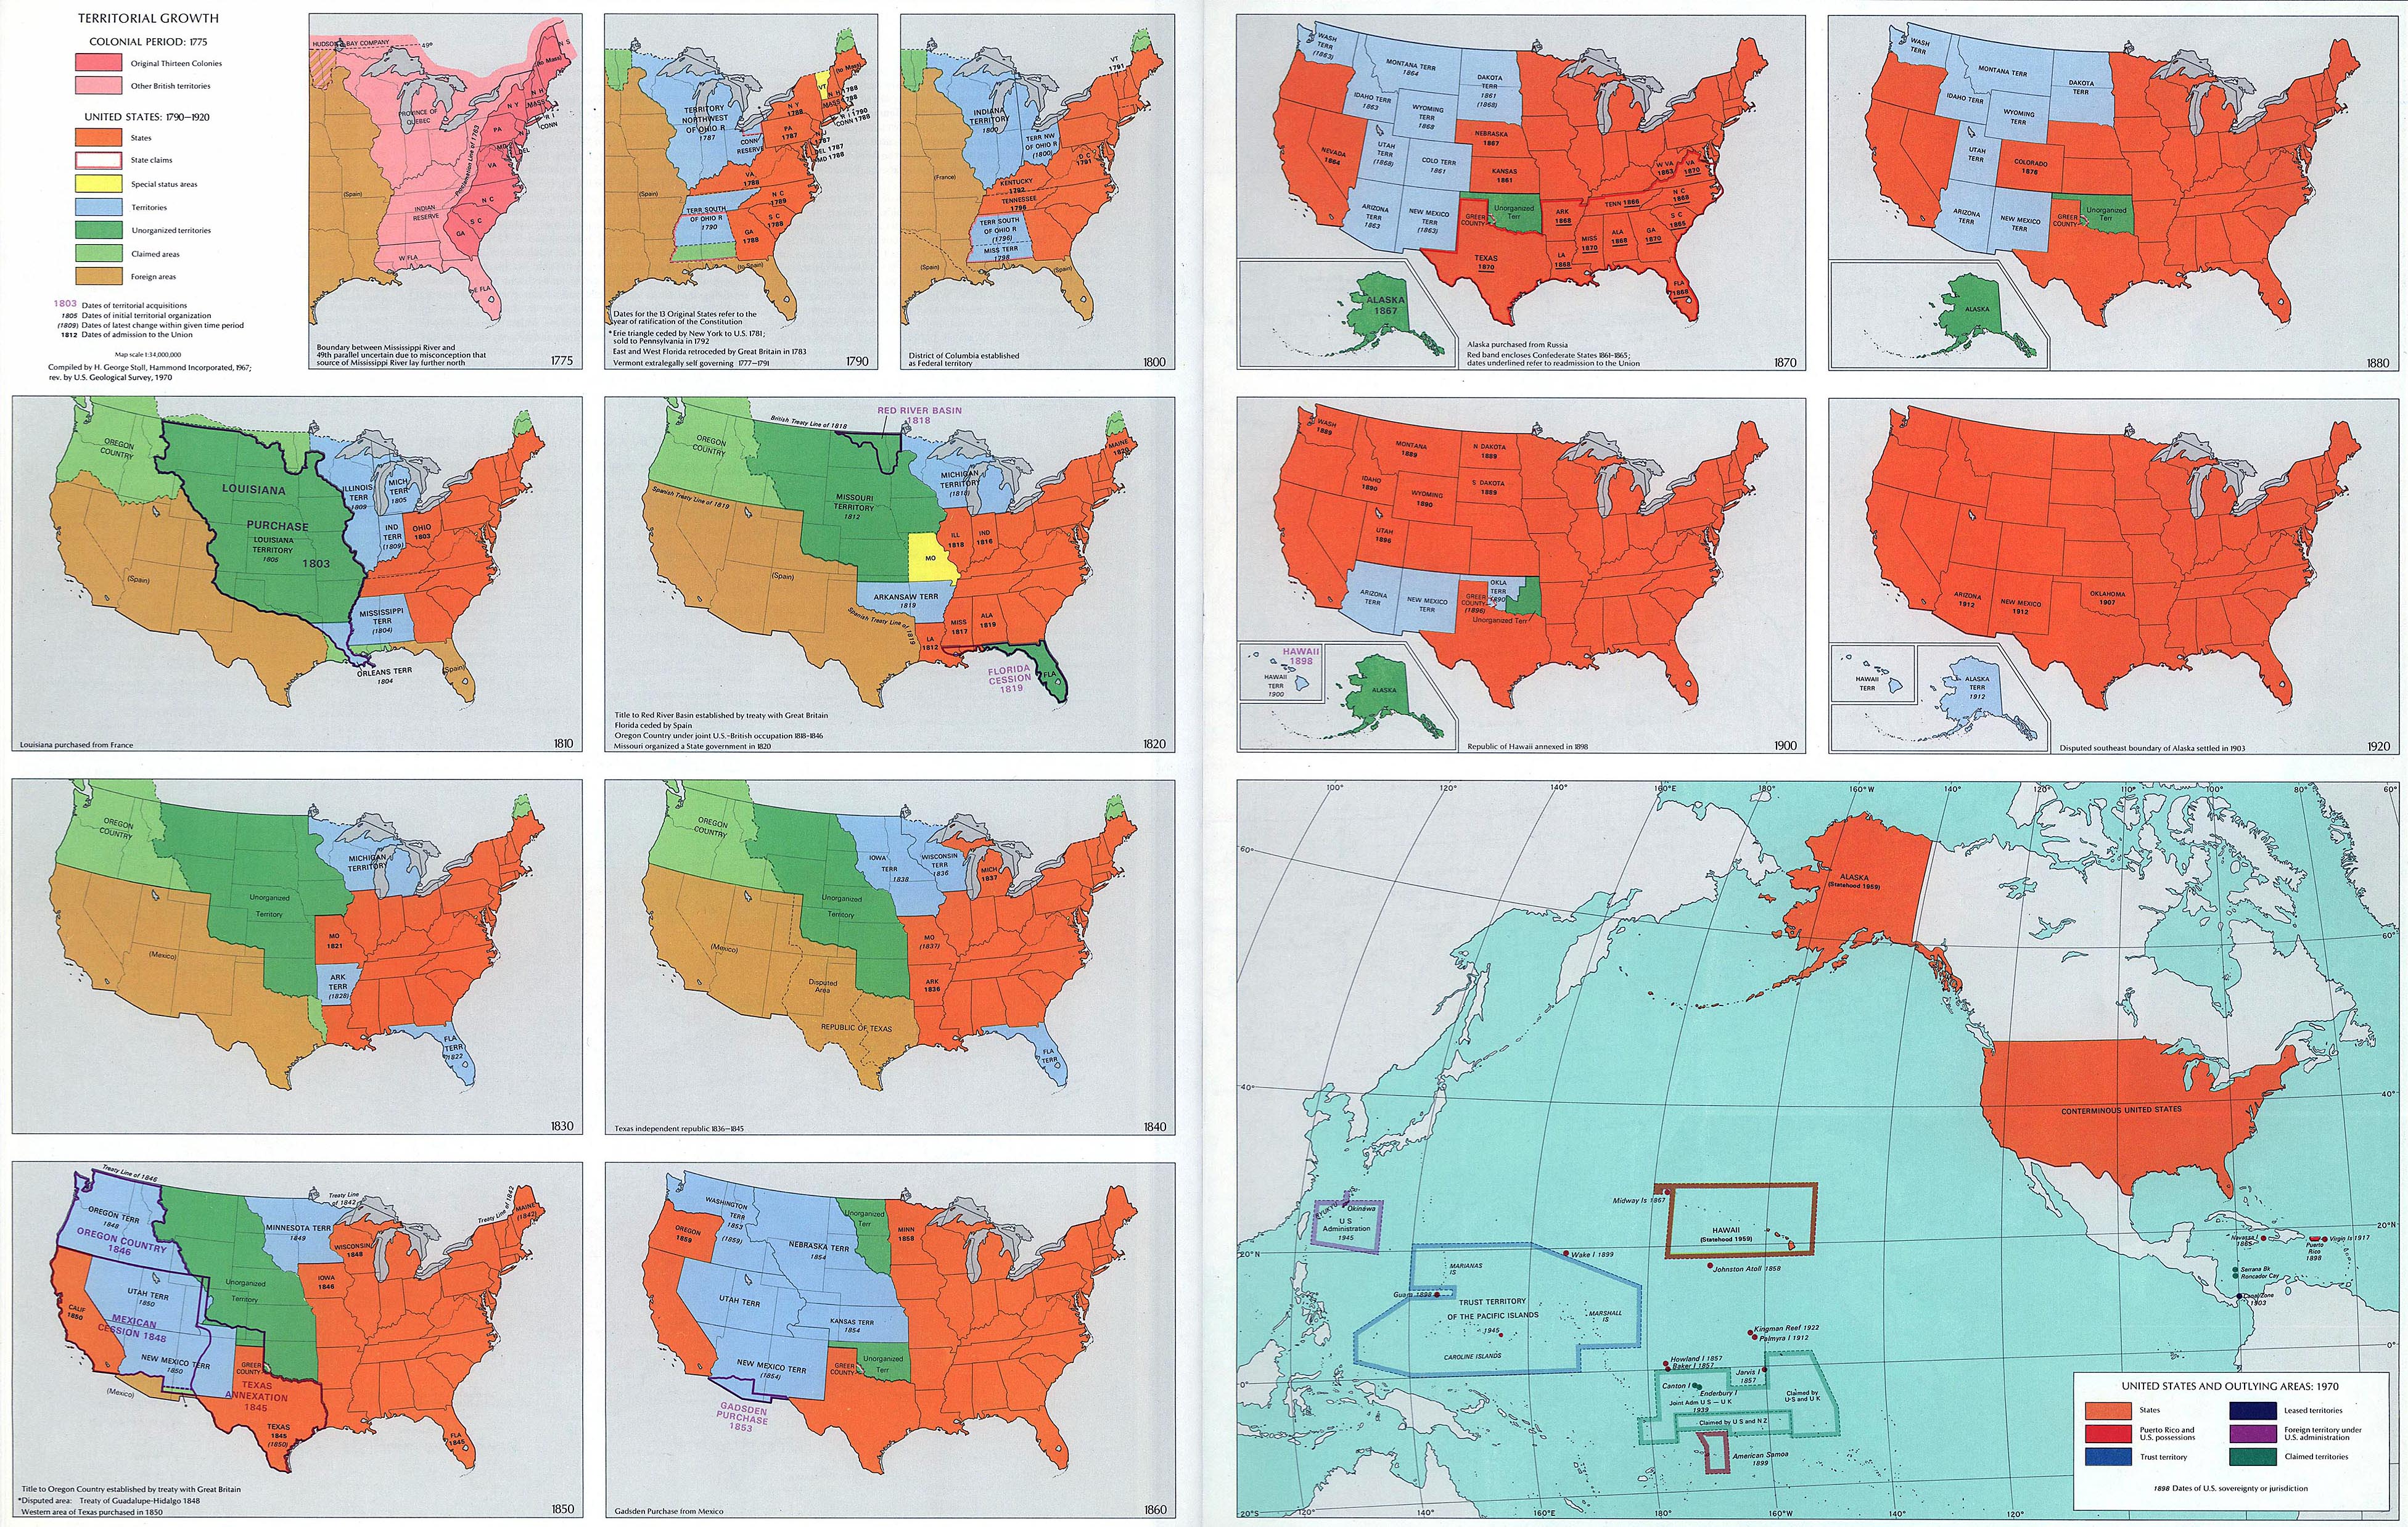
Fourteen maps of the United States: Territorial Growth 1775-1970
Historical Map Of The United States Displaying States And Territories

Historical Map of the United States Displaying States and Territories ...
Growth Of United States, 1776-1853. - Maps On The Web

Growth of United States, 1776-1853. - Maps on the Web
Antique Map Of The United States With Historical Flags

Antique Map of the United States with Historical Flags
Growth Of The United States Map - Oconto County Plat Map
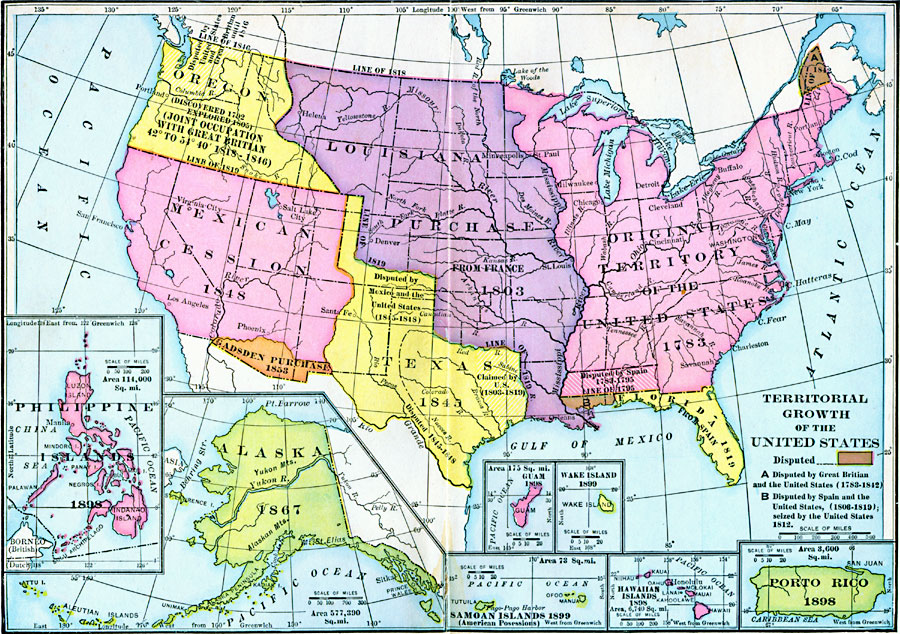
Growth Of The United States Map - Oconto County Plat Map
The Comprehensive Series Of Historical-Geographical Maps Of The United
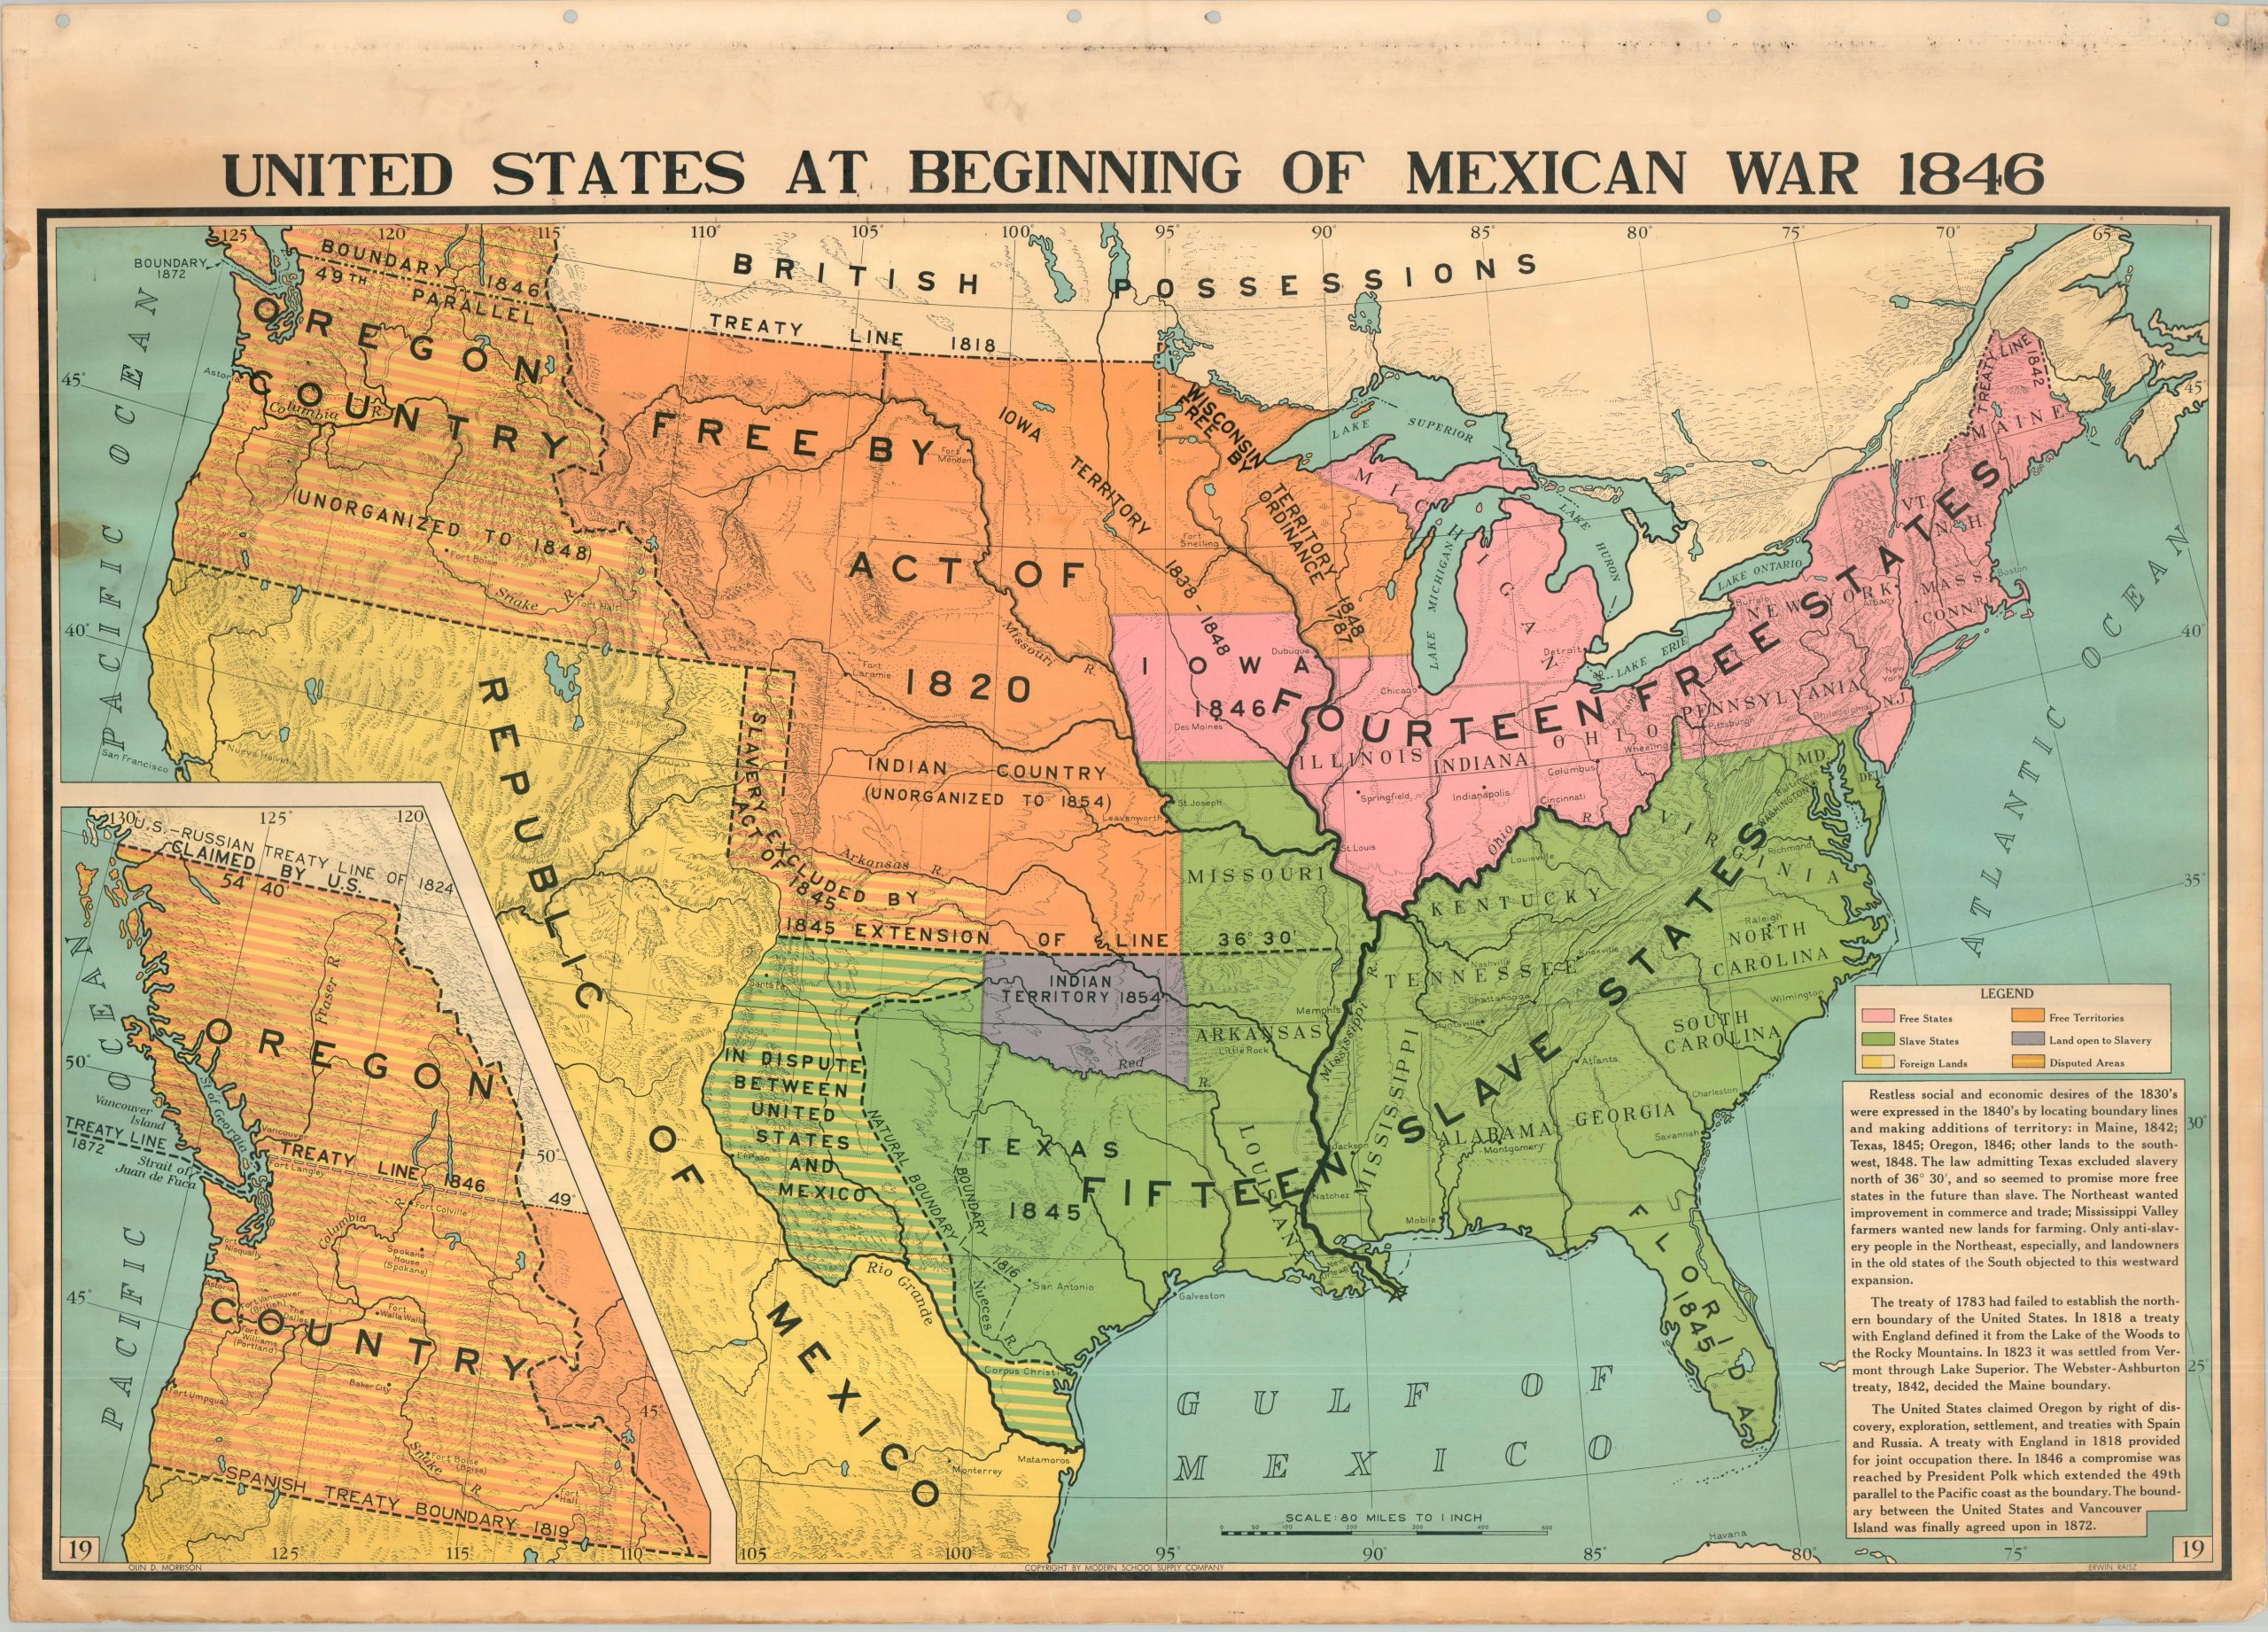
The Comprehensive Series of Historical-Geographical Maps of the United ...
Map Of The United States (united States) Showing The Growth Of The
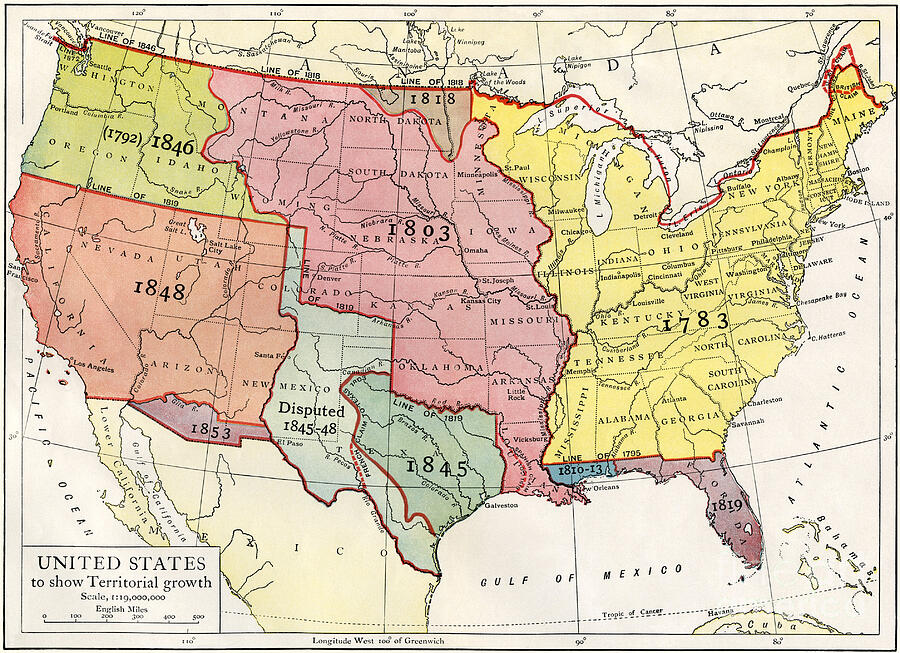
Map Of The United States (united States) Showing The Growth Of The ...
Map Showing The Territorial Growth Of The United States 1776-1886 De
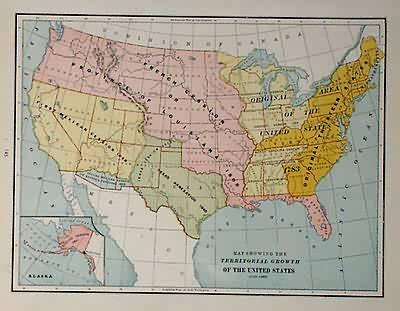
Map Showing the Territorial Growth of the United States 1776-1886 de ...
History Classroom Maps - Page 2 Of 6 - The Map Shop

History Classroom Maps - Page 2 of 6 - The Map Shop
A Map Of The United States At The Close Of The Revolutionary War. 1492

A Map of the United States at the Close of the Revolutionary War. 1492 ...
Map Showing The Territorial Growth Of The United States 1776-1887

Map showing the Territorial Growth of the United States 1776-1887 ...
Image Of Map Of The United States Of 1803 Showing The Partition

Image of Map of the United States of 1803 showing the partition
Map Of Us Before 1848
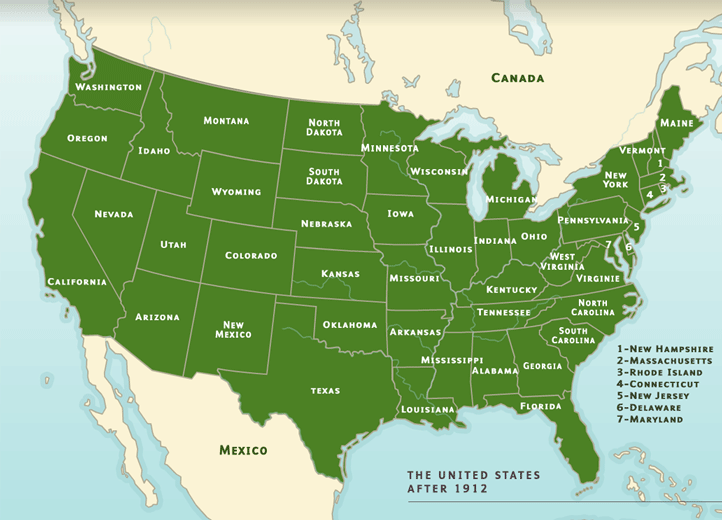
Map Of Us Before 1848
Mapped: The Territorial Evolution Of The United States
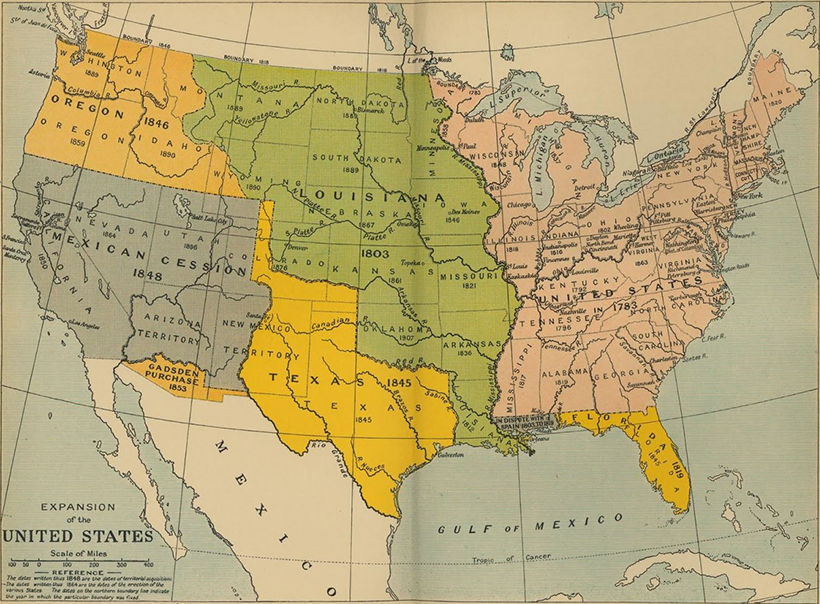
Mapped: The Territorial Evolution of the United States
Historical Maps Of US | PDF

Historical Maps of US | PDF
USA Maps

USA Maps
Historical Map Of The United States From 1776 Showing Early American

Historical Map of the United States from 1776 Showing Early American ...
Historical Maps Of The United States And North America - Vivid Maps
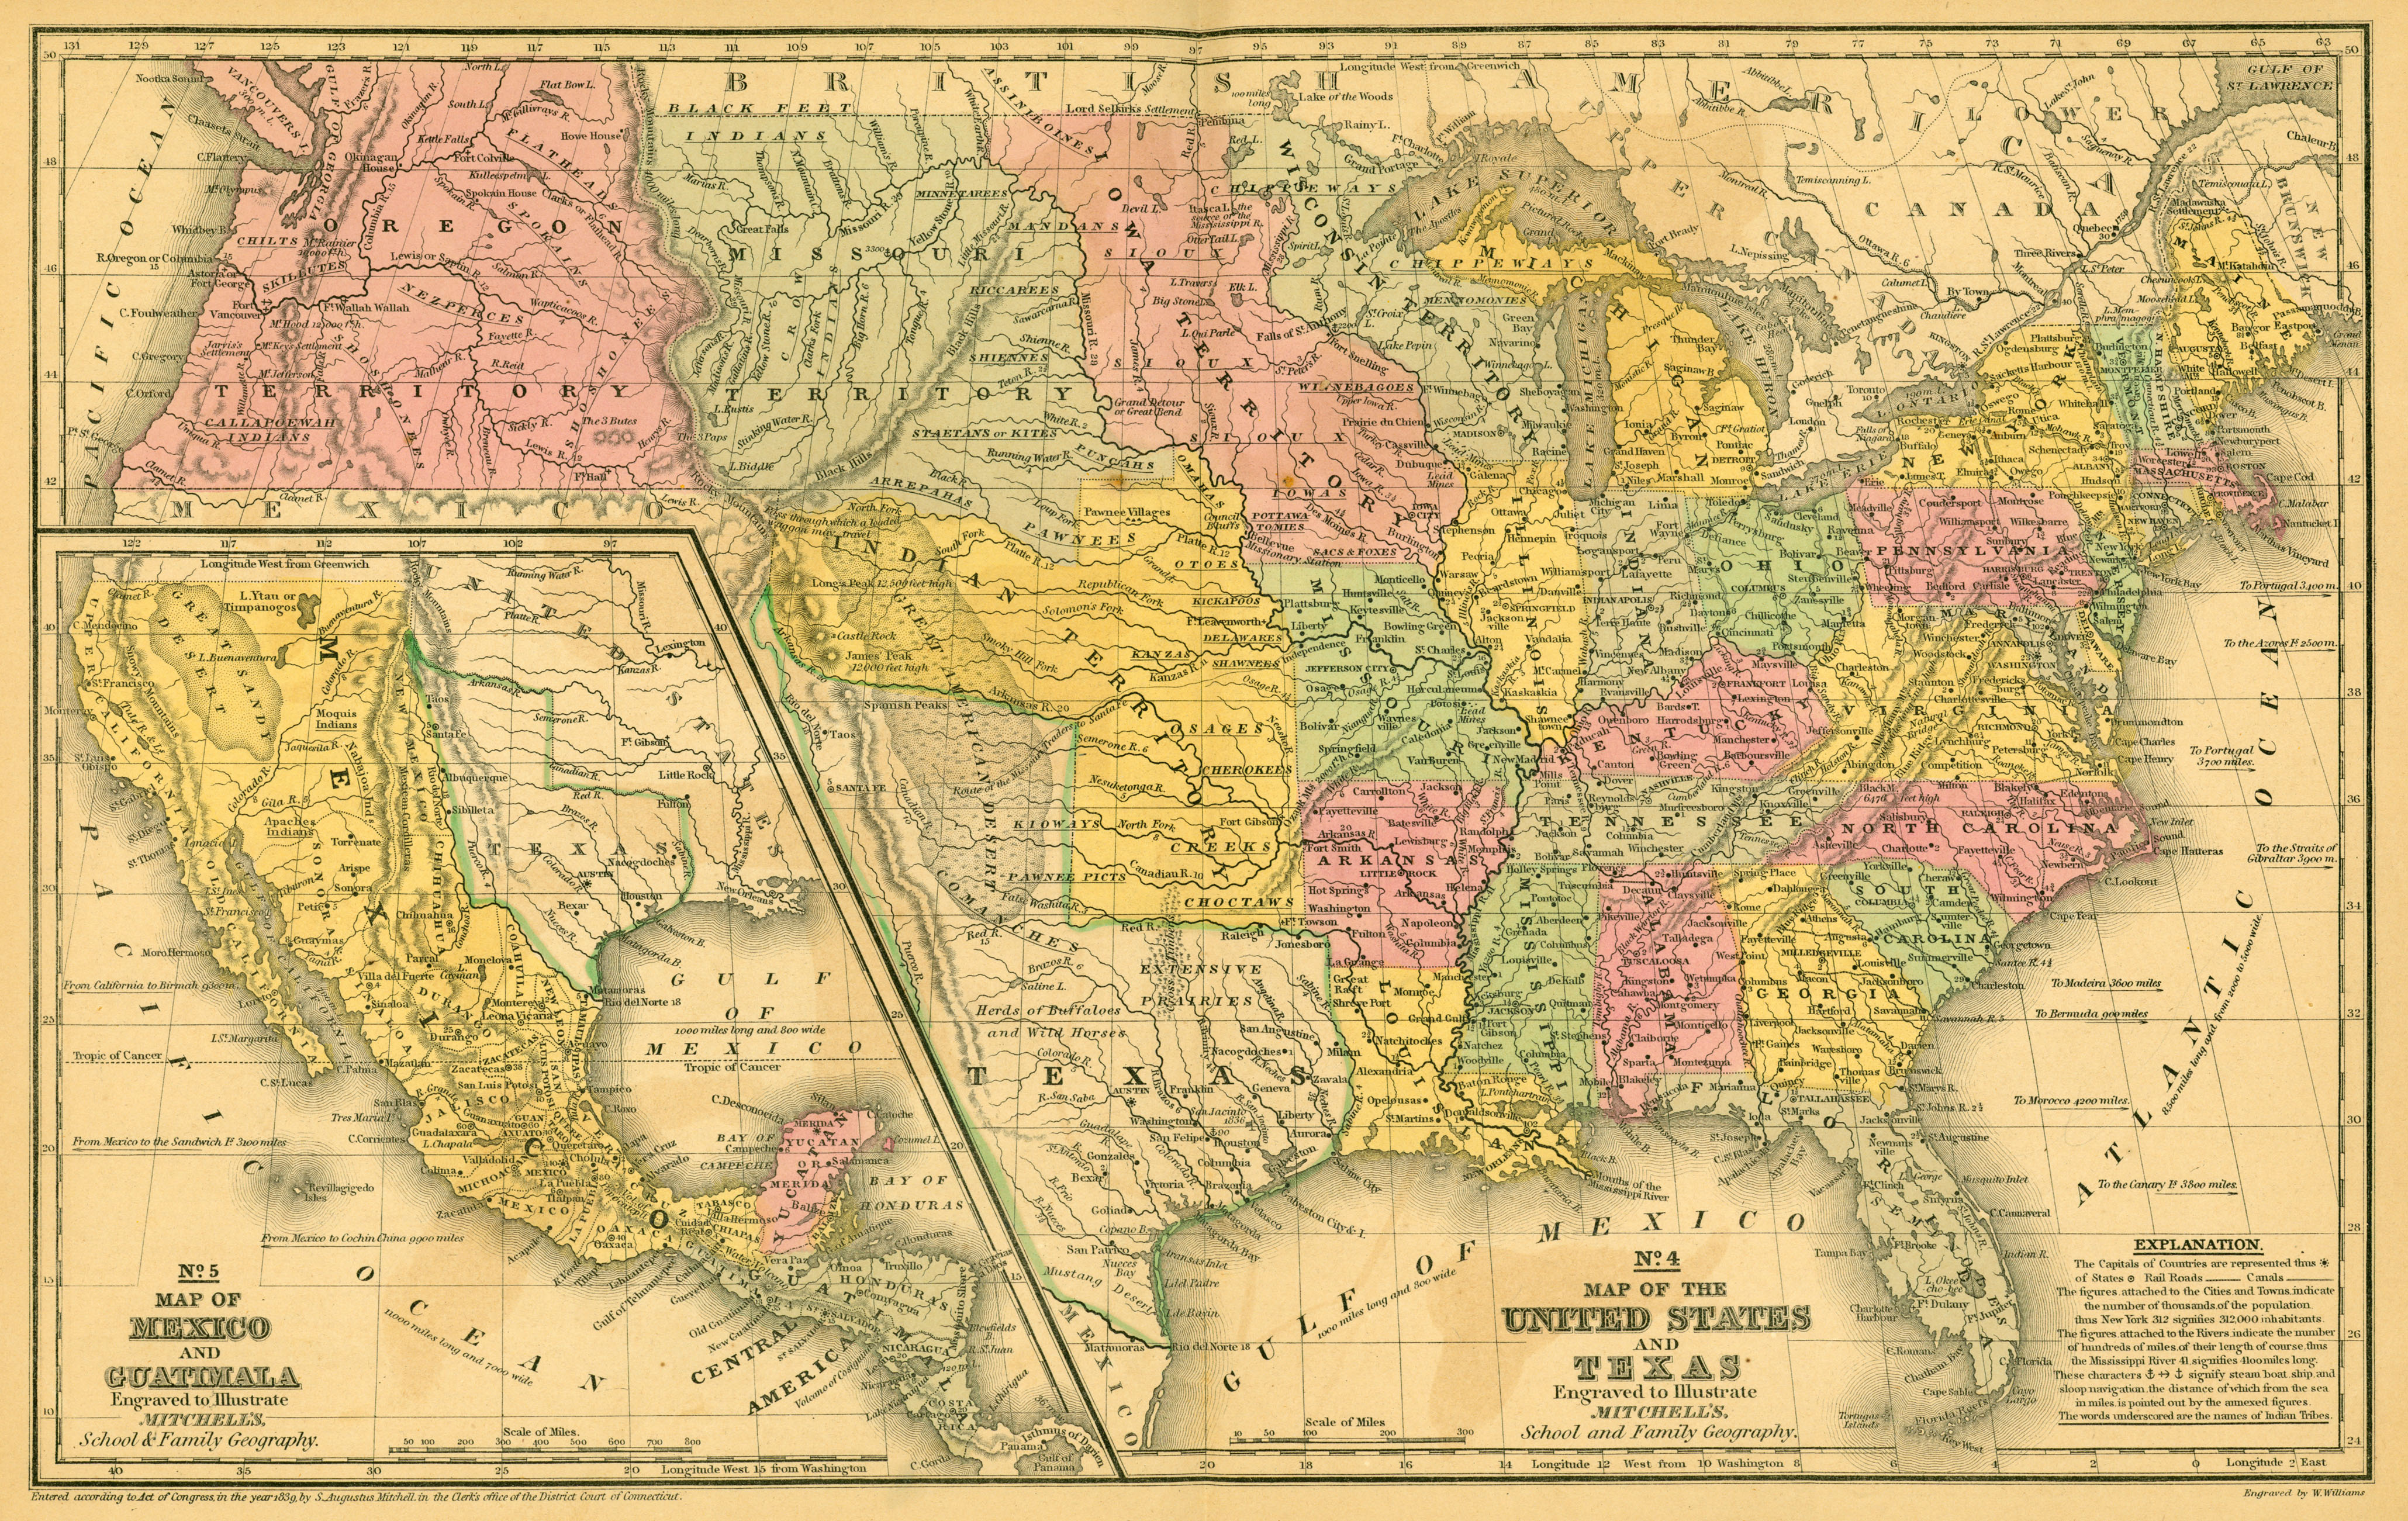
Historical Maps of the United States and North America - Vivid Maps
*A History Of The United States* (1921) Provides A Comprehensive
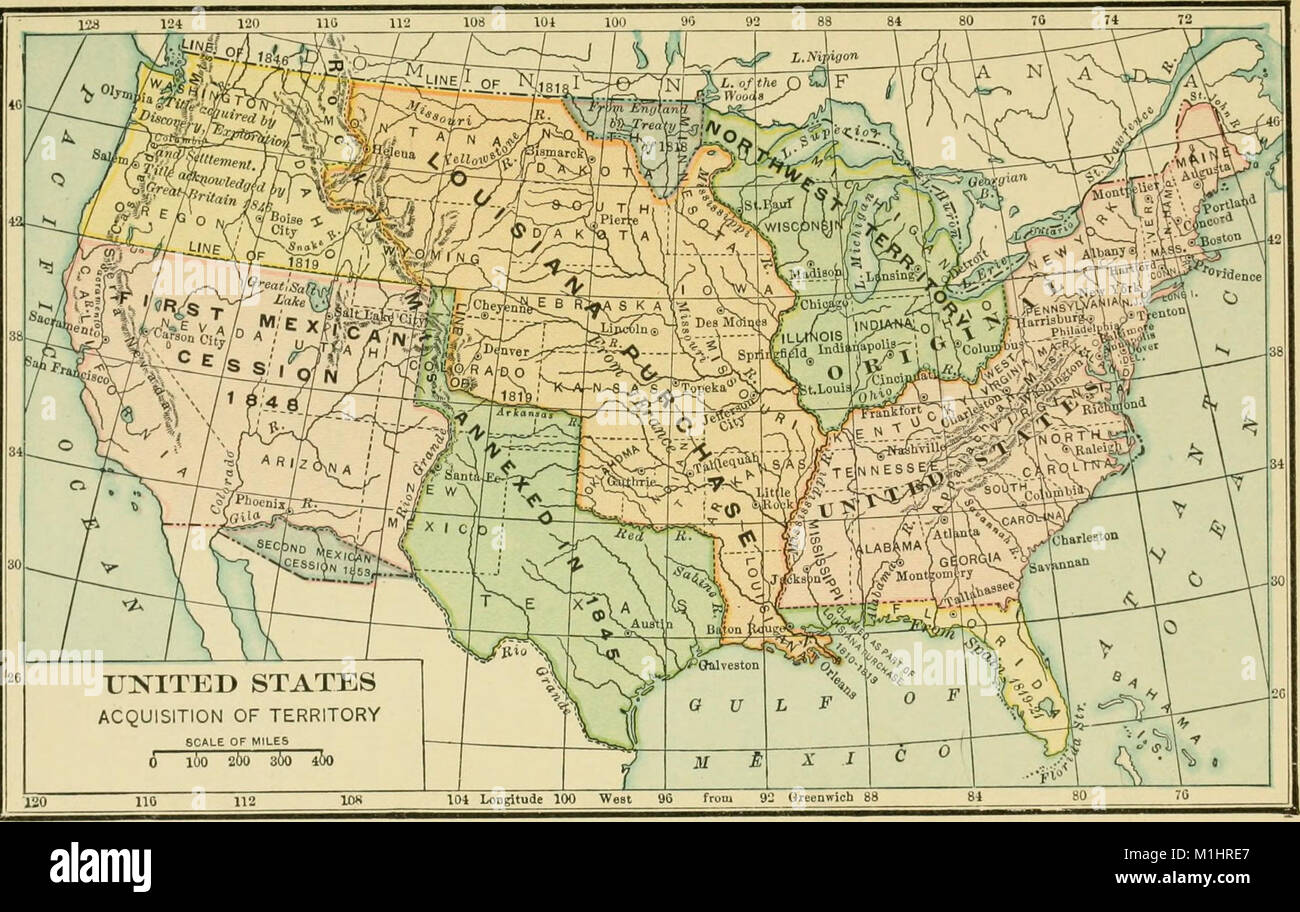
*A History of the United States* (1921) provides a comprehensive ...
A Territorial History Of The United States
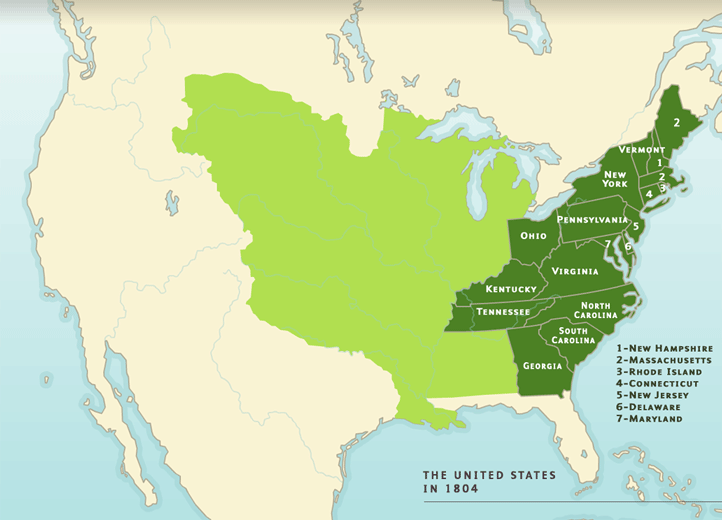
A territorial history of the United States
